Story Highlights
- Self-identified conservatives led liberals by nine percentage points in 2017
- First time in Gallup trend that conservative edge is less than 10 points
- Half of Democrats identify as liberal for first time
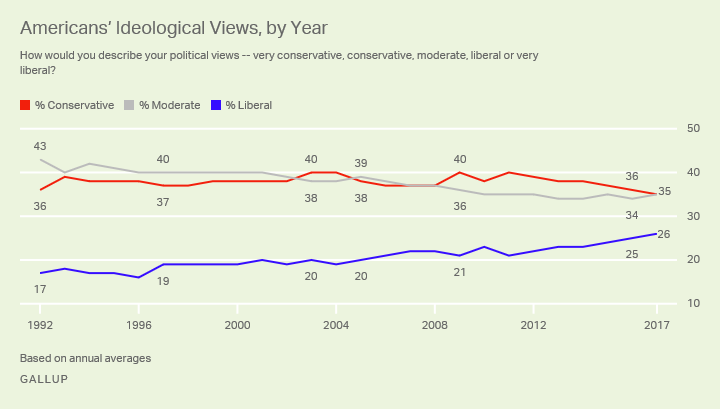
WASHINGTON, D.C. -- Continuing a quarter-century trend, the term "liberal" continues to catch up with "conservative" as Americans' preferred description of their political views. Thirty-five percent of U.S. adults in 2017 identified as conservative and 26% as liberal, the first time the conservative label's edge has been single digits. Its nine-percentage-point edge in 2017 is down from 11 points in 2016 and roughly 20-point advantages at times in the past.

Longer term, the percentage of U.S. adults identifying as liberal has climbed from 17% the first year Gallup used this measure in 1992 to 26% in 2017, while the percentage calling themselves moderate has fallen from 43% to 35%. Conservatives' share of the political pie was about the same in 2017 (35%) as in 1992 (36%), although it rose to 40% several times in between. The residual group, generally 4% to 5% in recent years, is unable, or refuses, to classify themselves with one of the three terms.
There have been some interruptions in the rise of liberalism, most notably a period of stability (at 19%) from 1997 to 2000, and some slight reversals at the start of Barack Obama's presidency. But the long-term pattern is one of a growing proportion of liberals, offset mainly by fewer moderates.
These findings are based on annual averages of Gallup's multiday, nontracking surveys. The 2017 aggregate includes 13 different surveys conducted between January and December, totaling 12,766 national adults.
Leftward Shift Mainly Attributable to Democrats
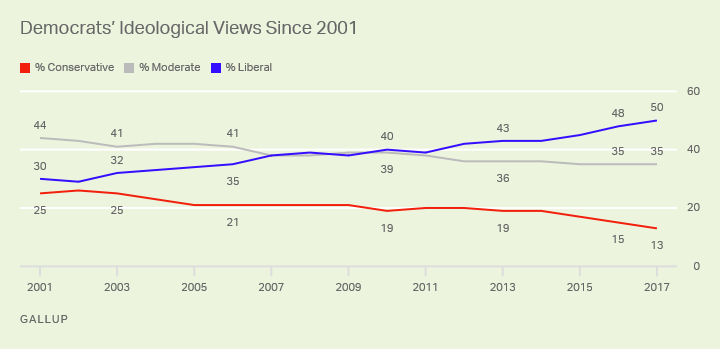
Almost all of the shift since 2001 toward the liberal label is the result of Democrats increasingly adopting the term. As a result, the Democratic Party has moved from a fairly mixed party ideologically at the start of the century to one that is now decidedly left-leaning.
In 2001, nearly as many Democrats identified as conservative (25%) as liberal (30%), while the largest segment, 44%, were moderate. Since then, the percentage of Democrats identifying as liberal has risen by about a point a year, reaching 50% this year for the first time.
Meanwhile, fewer and fewer Democrats have identified as moderate or conservative.

GOP Remains a Mainly Conservative Party
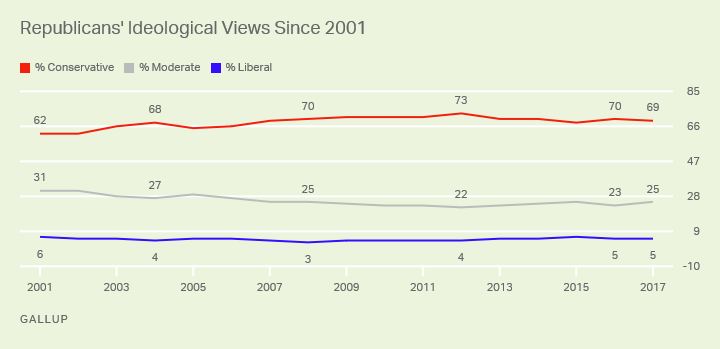
The Republican Party has undergone far less ideological change over the past 17 years, with the vast majority of its supporters consistently seeing themselves as conservative and most of the rest identifying as moderate. No more than 6% have called themselves liberal across the entire 2001 to 2017 period.
The only change in Republicans' ideology has been at the margins, including a seven-point increase since 2001 in the percentage identifying as conservative. There has been a corresponding decline since 2001 in the percentage identifying as moderate -- now 25%, down from 31%.

Independents' ideological views have varied over the past 17 years, but after a slight increase in conservatism from 2009 to 2013, their ideological profile has returned to what it was in 2001.
The largest segment of independents -- 43% in 2017 -- has consistently been moderate, while slightly more have identified as conservative than liberal.

Stark Ideological Differences Seen by Gender, Age, Education and Region
As shown in the accompanying table of 2017 results, Gallup also sees differences in Americans' ideological views among demographic groups. The greatest of these are by age and education, as older and less-educated adults tend to be conservative, while younger and more highly educated adults tend to be liberal.
There is also a sizable spread by gender, although neither group tilted liberal in 2017. Men showed a 16-point preference for the conservative label, while women were closely split between conservative and liberal.
| Conservative | Moderate | Liberal | % Conservative minus % Liberal | |||||||||||||||||||||||||||||||||||||||||||||||||||||||||||||||||||||||||||||||||||||||||||||||||
|---|---|---|---|---|---|---|---|---|---|---|---|---|---|---|---|---|---|---|---|---|---|---|---|---|---|---|---|---|---|---|---|---|---|---|---|---|---|---|---|---|---|---|---|---|---|---|---|---|---|---|---|---|---|---|---|---|---|---|---|---|---|---|---|---|---|---|---|---|---|---|---|---|---|---|---|---|---|---|---|---|---|---|---|---|---|---|---|---|---|---|---|---|---|---|---|---|---|---|---|---|
| % | % | % | pct. pts. | |||||||||||||||||||||||||||||||||||||||||||||||||||||||||||||||||||||||||||||||||||||||||||||||||
| Gender | ||||||||||||||||||||||||||||||||||||||||||||||||||||||||||||||||||||||||||||||||||||||||||||||||||||
| Men | 38 | 36 | 22 | +16 | ||||||||||||||||||||||||||||||||||||||||||||||||||||||||||||||||||||||||||||||||||||||||||||||||
| Women | 31 | 34 | 30 | +1 | ||||||||||||||||||||||||||||||||||||||||||||||||||||||||||||||||||||||||||||||||||||||||||||||||
| Age | ||||||||||||||||||||||||||||||||||||||||||||||||||||||||||||||||||||||||||||||||||||||||||||||||||||
| 18 to 29 | 23 | 40 | 32 | -9 | ||||||||||||||||||||||||||||||||||||||||||||||||||||||||||||||||||||||||||||||||||||||||||||||||
| 30 to 49 | 32 | 36 | 29 | +3 | ||||||||||||||||||||||||||||||||||||||||||||||||||||||||||||||||||||||||||||||||||||||||||||||||
| 50 to 64 | 40 | 35 | 21 | +19 | ||||||||||||||||||||||||||||||||||||||||||||||||||||||||||||||||||||||||||||||||||||||||||||||||
| 65+ | 45 | 29 | 23 | +22 | ||||||||||||||||||||||||||||||||||||||||||||||||||||||||||||||||||||||||||||||||||||||||||||||||
| Education | ||||||||||||||||||||||||||||||||||||||||||||||||||||||||||||||||||||||||||||||||||||||||||||||||||||
| High school or less | 39 | 34 | 22 | +17 | ||||||||||||||||||||||||||||||||||||||||||||||||||||||||||||||||||||||||||||||||||||||||||||||||
| Some college | 36 | 36 | 24 | +12 | ||||||||||||||||||||||||||||||||||||||||||||||||||||||||||||||||||||||||||||||||||||||||||||||||
| College graduate | 32 | 36 | 30 | +2 | ||||||||||||||||||||||||||||||||||||||||||||||||||||||||||||||||||||||||||||||||||||||||||||||||
| Postgraduate | 25 | 35 | 38 | -13 | ||||||||||||||||||||||||||||||||||||||||||||||||||||||||||||||||||||||||||||||||||||||||||||||||
| Region | ||||||||||||||||||||||||||||||||||||||||||||||||||||||||||||||||||||||||||||||||||||||||||||||||||||
| East | 29 | 35 | 32 | -3 | ||||||||||||||||||||||||||||||||||||||||||||||||||||||||||||||||||||||||||||||||||||||||||||||||
| Midwest | 36 | 36 | 24 | +12 | ||||||||||||||||||||||||||||||||||||||||||||||||||||||||||||||||||||||||||||||||||||||||||||||||
| South | 40 | 35 | 20 | +20 | ||||||||||||||||||||||||||||||||||||||||||||||||||||||||||||||||||||||||||||||||||||||||||||||||
| West | 32 | 34 | 30 | +2 | ||||||||||||||||||||||||||||||||||||||||||||||||||||||||||||||||||||||||||||||||||||||||||||||||
| Party ID | ||||||||||||||||||||||||||||||||||||||||||||||||||||||||||||||||||||||||||||||||||||||||||||||||||||
| Republicans | 69 | 25 | 5 | +64 | ||||||||||||||||||||||||||||||||||||||||||||||||||||||||||||||||||||||||||||||||||||||||||||||||
| Independents | 29 | 43 | 24 | +5 | ||||||||||||||||||||||||||||||||||||||||||||||||||||||||||||||||||||||||||||||||||||||||||||||||
| Democrats | 13 | 35 | 50 | -37 | ||||||||||||||||||||||||||||||||||||||||||||||||||||||||||||||||||||||||||||||||||||||||||||||||
| 2017 averages | ||||||||||||||||||||||||||||||||||||||||||||||||||||||||||||||||||||||||||||||||||||||||||||||||||||
| Gallup | ||||||||||||||||||||||||||||||||||||||||||||||||||||||||||||||||||||||||||||||||||||||||||||||||||||
Ideology also differs significantly by U.S. region, generally conforming with traditional red-/blue-state voting patterns. Residents of the East are more likely to be liberal than conservative by a three-point margin, whereas residents of the Midwest and South lean conservative by double-digit margins. Residents of the West are closely split.

