Story Highlights
- 70% of Republicans dissatisfied, down from 77% in 2017
- Democratic dissatisfaction has risen 20 points between 2017 and 2018
- Few dissatisfied Democrats favor decreased levels of immigration
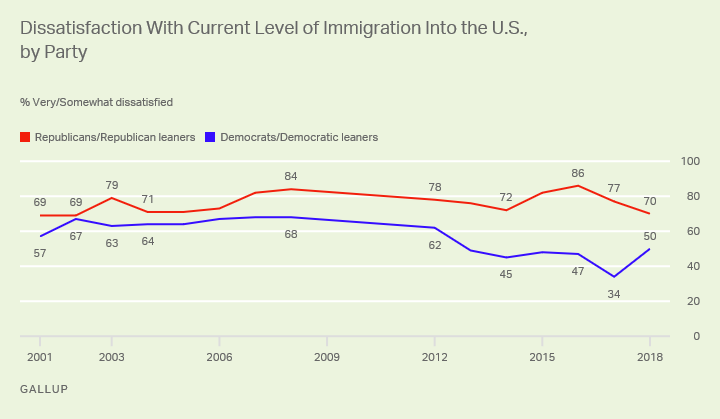
WASHINGTON, D.C. -- Seven in 10 Republicans, versus half of Democrats, now say they are "somewhat dissatisfied" or "very dissatisfied" with current U.S. immigration levels. Republicans' dissatisfaction is down from a peak of 86% in 2016, while Democrats' has rebounded after dropping to a low point of 34% in 2017.

Dissatisfaction with immigration among Democrats and independents who lean Democratic fell from 62% to 49% between 2012 and 2013 after President Barack Obama issued an executive order, known as Deferred Action for Childhood Arrivals (DACA), which granted legal protections for immigrants who entered the U.S. illegally at a young age with their parents. Democrats' dissatisfaction with the level of immigration dropped again in Obama's final days in office in 2017 but rose sharply this year, climbing 16 percentage points to 50% in a Jan. 2-7 poll. Dissatisfaction among Democrats is roughly back to where it was between 2013 and 2016 but remains lower than it was under the George W. Bush administration.
Meanwhile, dissatisfaction with immigration among Republicans and Republican leaners rose sharply from 72% in 2014 to its peak of 86% in 2016. The Trump campaign rode this wave of Republican frustration with immigration, making building a wall along the U.S. border with Mexico to curb illegal immigration a central campaign tenet and a rallying cry during campaign events.
Partisan views on immigration since Donald Trump became president appear to reflect the rhetoric and actions of his administration during his first year in office. Republicans' dissatisfaction with immigration has dropped 16 points since Trump was elected, while Democrats' dissatisfaction has risen 16 points between 2017 and 2018.
The decline in Republicans' dissatisfaction over the past two years likely reflects their optimism that immigration will be or is being tightened under Trump, which has, in turn, increased Democrats' frustrations. Since he took office, the Trump administration has ordered increased deportations of immigrants who entered the U.S. illegally; threatened to withhold federal funding from "sanctuary cities" that choose not to enforce federal immigration laws; set a deadline to end DACA; and introduced policies to prevent people from countries the administration deems dangerous from traveling to the U.S.
Partisans React Differently to Dissatisfaction With Immigration
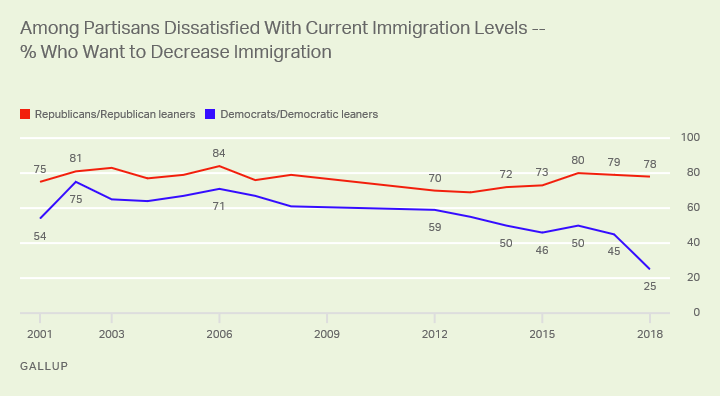
Gallup's January survey asked those who are dissatisfied with the level of immigration into the U.S. if they want to see immigration increased, decreased or remain the same. Republicans and Democrats who are dissatisfied with current immigration levels increasingly favor opposing solutions.
From 2001 through 2013, majorities of dissatisfied Republicans and Democrats said they wanted to see the level of immigration decreased. Since then, the percentage of dissatisfied Republicans choosing the "decreased" option has remained high, while the percentage of dissatisfied Democrats who want to decrease immigration has dropped to 50% or below. In the past year alone, the percentage of dissatisfied Democrats who favor decreased immigration plunged 20 points to 25%. Democrats dissatisfied with the level of immigration, in turn, have become increasingly likely to say that immigration should be increased, rising 29 points from 10% in 2016 to 39% this year.

Since the inception of this trend in 2001, Republicans' preference for less immigration has consistently exceeded Democrats', even as both groups' preferences for decreased immigration dipped slightly between 2002 and 2004 and again between 2008 and 2013. However, the gap between Republicans and Democrats widened beginning in 2014 and has been at least 30 points since 2016.

