Adults Nearing Retirement Worry Most About Social Security
by Justin McCarthy
Story Highlights
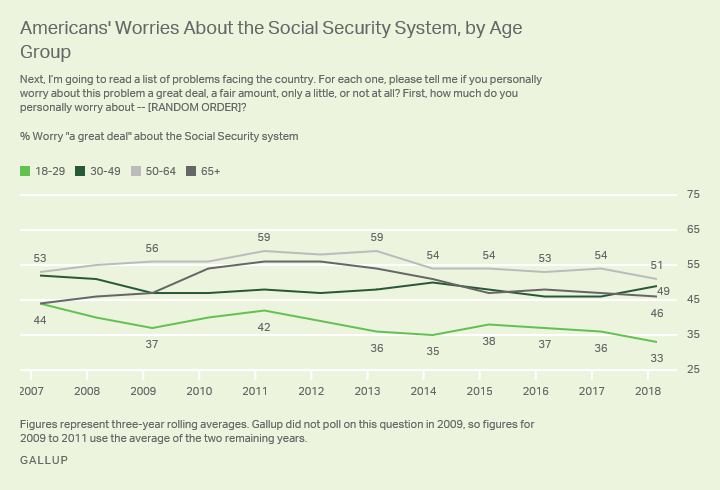
- 51% of 50- to 64-year-olds worry "a great deal" about the system
- Low-income adults' worries down from post-recession high
- Nationally, 44% express concern about the Social Security system
WASHINGTON, D.C. -- A slight majority of pre-retirement aged Americans,
51%, say they are worried a "great deal" about the Social Security
system. This level of concern among adults aged 50 to 64 represents the
greatest worry about the benefits program of all age groups. One-third
of young adults, aged 18 through 29, worry a great deal about the Social
Security system.
The latest figures are based on combined 2016-2018 data, allowing for greater
stability in the findings by age. The trend represents three-year rolling
averages starting in 2007.
The percentage of 50- to 64-year-olds who are worried a great deal about
the Social Security system is smaller than the high of 59% recordedin
three-year rolling averages for 2009 to 2011 and 2011 to 2013.
The current 33% of 18- to 29-year-olds worried about Social Security is
slightly lower than averages in recent years, and down a more significant
11 percentage points from 2007.
Less than half of adults who are at the retirement age of 65 or older (46%)
say they worry a great deal about Social Security. By contrast, majorities
of adults in this age group were concerned about the program during the
immediate post-recession years, peaking at 56% in the average for 2010
to 2012. Worry among retirement-aged adults has gradually declined since,
though, with the current level of worry at its lowest since the average
for 2006 to 2008.
Meanwhile, worries about Social Security among adults aged 30 to 49 have
varied the least; the current 49% who worry a great deal among this age
group is within the fairly narrow range of 46% to 52% averages recorded
since 2005.
This year's data, recorded in a March 1-8 Gallup poll, found that 44%
of Americans worry a "great deal," and 28% say they worry a
"fair amount," while about one in four worry "only a little"
(17%) or "not at all" (10%).
The current 44% who worry a great deal is slightly lower than the 45% to
53% range recorded since 2005.
This comes as Social Security recipients will receive the largest cost
of living adjustment in six years -- though for many, these increases
will be offset by higher Medicare premiums. Social Security is one of
15 issues or social problems Gallup asked Americans to rate their worry
on in the March poll. It ranks near the middle of the list. Americans remain
most worried about the availability and affordability of healthcare.
Low-Income Adults Remain More Worried About the Program Than Higher Earners
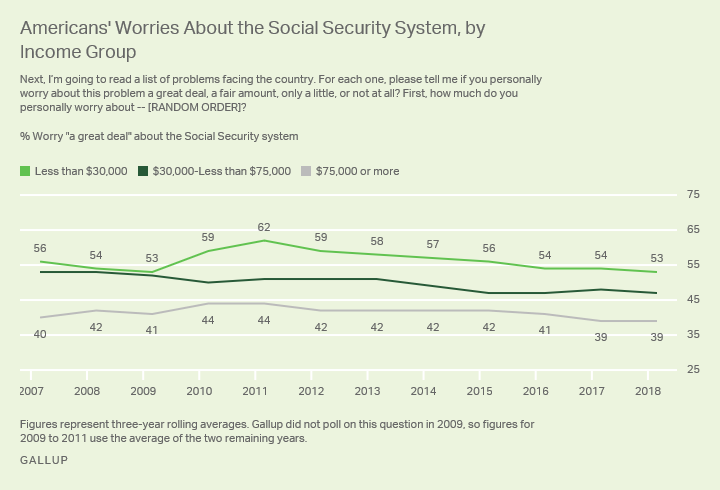
Lower-income Americans have consistently expressed the most concern about
the Social Security system. Consistent majorities of U.S. adults in households
with annual incomes of $30,000 or less have expressed a great deal of
worry in averages since 2005. Worry about the program peaked at 62% in
the average for 2009 to 2011 but gradually declined in the years that
followed. The current 53% who report worrying a great deal about it matches
the low recorded in the 2007 to 2009 average.
Worries among higher-earning groups have been much more stable.
Forty-seven percent of adults with annual household incomes between $30,000
and $74,999 report being worried about the program, which is within the
narrow 47% to 53% range recorded for this group between 2005 and 2018.
Americans living in households with annual incomes of $75,000 or higher
have consistently been the least likely to report worries about Social
Security. The current 39% matches the figure recorded in the previous
rolling average and is slightly lower than the 40% to 44% averages recorded
prior to that.
Bottom Line
Americans' level of worry about the Social Security system is on the
low end of the nearly two-decade trend, but the financial solvency of
the program's fate is in jeopardy, as it faces long-term sustainability
challenges. So, while Americans' concerns may have shifted elsewhere
over the years, the question of how to fund the Social Security system
and whether to make adjustments to the program will undoubtedly return
at some point -- and Americans' worries about it could return to their
post-recession levels.
Concerns have eased slightly among those who are nearing the age at which
they will receive Social Security. Meanwhile, young adults are less concerned
about the program than they have been in Gallup's tracking, and less
worried than the older age groups -- perhaps due to the many decades they
have to wait until their first check. A smaller majority of lower-income
adults are worried about the program than was the case after the recession,
but this income group remains more worried than those with higher incomes.
Making changes to Social Security to ensure its continuance, a political
hot potato that no elected official wants to hold, has bedeviled many
presidents. Most recently, worries about the program increased during
the first half of Barack Obama's presidency, when his attempts to
address the issue troubled even his own party. Prior to that, George W.
Bush's attempts to privatize Social Security failed in his second term.
Though the question of how to maintain funding for the program long-term
is by no means solved, the issue has, at least for now, become slightly
less troubling to Americans, as their concerns remain more about healthcare
affordability.
Survey Methods
Results for this Gallup poll are based on telephone interviews conducted
March 1-8, 2018, with a random sample of 1,041 adults, aged 18 and older,
living in all 50 U.S. states and the District of Columbia. For results
based on the total sample of national adults, the margin of sampling error
is ±4 percentage points at the 95% confidence level. All reported
margins of sampling error include computed design effects for weighting.
Each sample of national adults includes a minimum quota of 70% cellphone
respondents and 30% landline respondents, with additional minimum quotas
by time zone within region. Landline and cellular telephone numbers are
selected using random-digit-dial methods.
Learn more about how the
Gallup Poll Social Series works.


