Story Highlights
- Index remains near 2017 low, occurring in May and June
- Ninth straight month the index has been positive
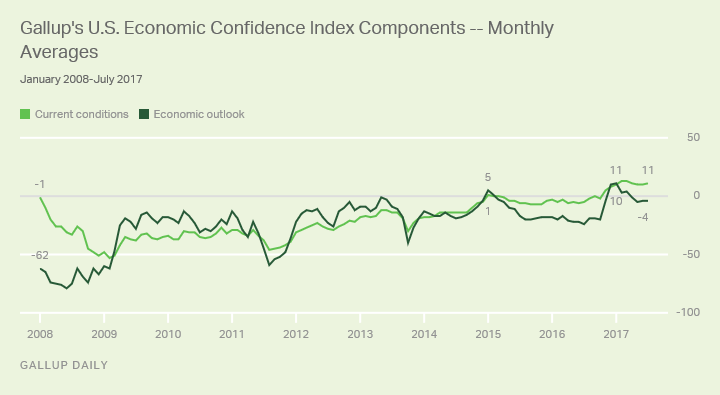
- Current conditions component at +11; outlook component at -4
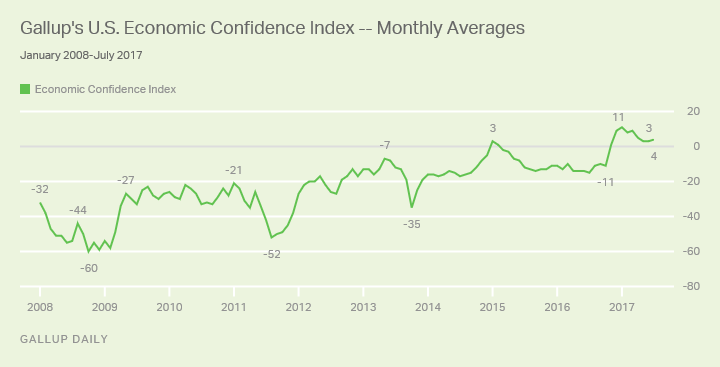
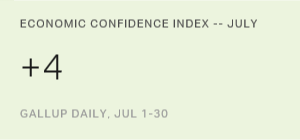
WASHINGTON, D.C. -- Americans' confidence in the economy was steady last month, with Gallup's U.S. Economic Confidence Index averaging +4 in July. This score is nearly identical to the 2017 low of +3 registered in May and June. Still, July marked the ninth consecutive month that Americans rated the economy more positively than negatively -- the longest such streak since Gallup began tracking economic confidence in 2008.

Gallup's U.S. Economic Confidence Index is the average of two components: how Americans rate current economic conditions and whether they believe the economy is improving or getting worse. The index has a theoretical maximum of +100 if all Americans were to say the economy is doing well and improving, and a theoretical minimum of -100 if all were to say the economy is doing poorly and getting worse.
On a weekly basis, the index's average has remained within a tight range of +2 and +4 for all but two of the last 12 weeks. This includes last week, July 24-30, when Gallup's U.S. Economic Confidence Index averaged +2.
Still, Americans were far more confident in the economy in July compared with virtually any time between January 2008 and November 2016, when confidence was routinely negative. Americans became more optimistic about the economy last November when the monthly average of the index climbed 12 points to +1. In January, economic confidence hit +11, its best month in nine years.
While Gallup's U.S. Economic Confidence Index remained close to this record high in February (+8) and March (+9), it began to slip in April, falling to +5 as Democrats' feelings about the economy continued to sour. This course continued in May, when the measure fell to +3 for the month.
Attitudes appear to have stabilized in the last two months, as evidenced by the index's lack of movement over that time frame.
More Americans Continue to See Economy as Getting Worse
Last month, Americans continued to see current economic conditions positively, with 33% describing the economy as "excellent" or "good," compared with 22% describing it as "poor." This leaves the current conditions component at +11 for the month -- nearly identical to its performance in June (+10).
In July, the greater share of Americans continued to see the economy as "getting worse" (49%) rather than "getting better" (45%), as has been the case since May. As a result, the economic outlook component equaled -4 last month, on par with May (-5) and June (-4).

Republicans, Higher Income and More-Educated Americans More Confident
No single group has seen a bigger boost in their level of economic confidence, compared with last July, than Republicans. Conversely, Democrats have seen the largest drop in economic confidence compared with one year ago. But while partisanship is by far the most influential factor in determining overall economic confidence, other attributes also play a role in shaping economic confidence.
Last month, Americans living in households earning $90,000 a year or more had the highest level of confidence in the economy (+18), compared with U.S. adults living in lower-income households. But confidence in the economy was positive among those in households earning $60,000-$89,999 a year, while it was negative for Americans in households earning $24,000-$59,999 (-1) or less than $24,000 (-18). Overall, confidence is up among all income categories, though it is up by the most percentage points with Americans in households earning $60,000-$89,999.
Similarly, college-educated Americans, who tend to enjoy higher earnings than do the less-educated, expressed higher confidence in the economy in July of both 2017 and 2016 than did non-college-educated Americans. However, economic confidence among non-college-educated Americans has risen 23 points since last year; among those with a college education, it is up six points.
| July 2016 index average | July 2017 index average | Change in index average | ||||||||||||||||||||||||||||||||||||||||||||||||||||||||||||||||||||||||||||||||||||||||||||||||||
|---|---|---|---|---|---|---|---|---|---|---|---|---|---|---|---|---|---|---|---|---|---|---|---|---|---|---|---|---|---|---|---|---|---|---|---|---|---|---|---|---|---|---|---|---|---|---|---|---|---|---|---|---|---|---|---|---|---|---|---|---|---|---|---|---|---|---|---|---|---|---|---|---|---|---|---|---|---|---|---|---|---|---|---|---|---|---|---|---|---|---|---|---|---|---|---|---|---|---|---|---|
| % | % | pct. pts. | ||||||||||||||||||||||||||||||||||||||||||||||||||||||||||||||||||||||||||||||||||||||||||||||||||
| All national adults | -15 | 4 | 19 | |||||||||||||||||||||||||||||||||||||||||||||||||||||||||||||||||||||||||||||||||||||||||||||||||
| Annual household income | ||||||||||||||||||||||||||||||||||||||||||||||||||||||||||||||||||||||||||||||||||||||||||||||||||||
| Less than $24,000 | -25 | -18 | 7 | |||||||||||||||||||||||||||||||||||||||||||||||||||||||||||||||||||||||||||||||||||||||||||||||||
| $24,000-$59,999 | -20 | -1 | 19 | |||||||||||||||||||||||||||||||||||||||||||||||||||||||||||||||||||||||||||||||||||||||||||||||||
| $60,000-$89,999 | -14 | 10 | 24 | |||||||||||||||||||||||||||||||||||||||||||||||||||||||||||||||||||||||||||||||||||||||||||||||||
| $90,000+ | -2 | 18 | 20 | |||||||||||||||||||||||||||||||||||||||||||||||||||||||||||||||||||||||||||||||||||||||||||||||||
| Education | ||||||||||||||||||||||||||||||||||||||||||||||||||||||||||||||||||||||||||||||||||||||||||||||||||||
| No college degree | -23 | 0 | 23 | |||||||||||||||||||||||||||||||||||||||||||||||||||||||||||||||||||||||||||||||||||||||||||||||||
| College degree or higher | 4 | 10 | 6 | |||||||||||||||||||||||||||||||||||||||||||||||||||||||||||||||||||||||||||||||||||||||||||||||||
| Gender | ||||||||||||||||||||||||||||||||||||||||||||||||||||||||||||||||||||||||||||||||||||||||||||||||||||
| Men | -11 | 16 | 27 | |||||||||||||||||||||||||||||||||||||||||||||||||||||||||||||||||||||||||||||||||||||||||||||||||
| Women | -18 | -9 | 9 | |||||||||||||||||||||||||||||||||||||||||||||||||||||||||||||||||||||||||||||||||||||||||||||||||
| Race and ethnicity | ||||||||||||||||||||||||||||||||||||||||||||||||||||||||||||||||||||||||||||||||||||||||||||||||||||
| Non-Hispanic white | -21 | 12 | 33 | |||||||||||||||||||||||||||||||||||||||||||||||||||||||||||||||||||||||||||||||||||||||||||||||||
| Non-Hispanic black | -6 | -33 | -27 | |||||||||||||||||||||||||||||||||||||||||||||||||||||||||||||||||||||||||||||||||||||||||||||||||
| Hispanic | 6 | -3 | -9 | |||||||||||||||||||||||||||||||||||||||||||||||||||||||||||||||||||||||||||||||||||||||||||||||||
| Gallup Daily | ||||||||||||||||||||||||||||||||||||||||||||||||||||||||||||||||||||||||||||||||||||||||||||||||||||
Notably, several of the subgroups that have seen the highest boost in economic confidence relative to last year are groups that were key to Donald Trump's electoral victory -- white Americans, the less-educated and men. Conversely, racial and ethnic minorities, whose confidence has fallen the farthest of all groups other than Democrats, strongly supported Trump's opponent in the election.


