Story Highlights
- 30% identify with a specific Protestant denomination; down from 50%
- There are fewer Protestants overall as more Americans say "no religion"
- Baptists remain the largest specific Protestant group
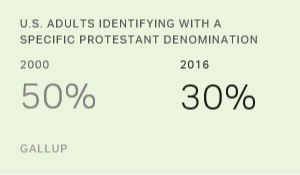
WASHINGTON, D.C. -- Americans have become less likely to identify with an official or formal religion in recent decades, and nowhere is this more evident than in the dwindling percentage who identify with a specific Protestant denomination. In 2000, 50% of Americans identified with a specific denomination; by 2016 that figure had dropped to 30%.
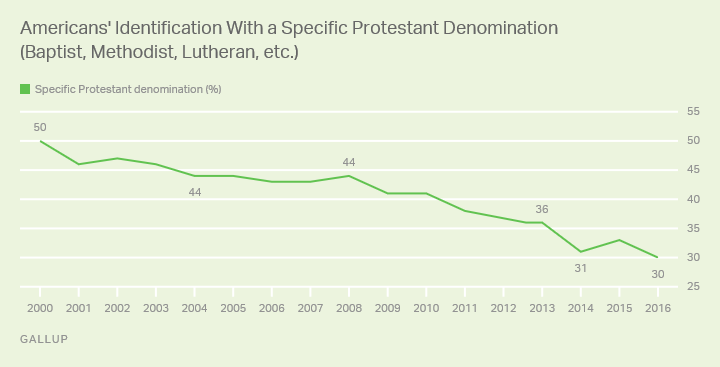
This shrinking proportion of Americans who identify with specific Protestant denominations is the result of two trends.
First, an increasing percentage of Americans are "nones," saying they don't have a specific religious identity of any kind. Since the percentages of Catholics, Mormons and those who identify with a non-Christian religion have stayed roughly the same over time, this "rise of the nones" -- from 10% in 2000 to 20% in 2016 -- has generally been accompanied by an associated decrease in the broad category of Protestants, whose numbers shrank from 57% to 47%. Therefore, there are fewer Protestants of any kind in the American population today, and the pool of those who identify with a specific Protestant denomination is smaller.
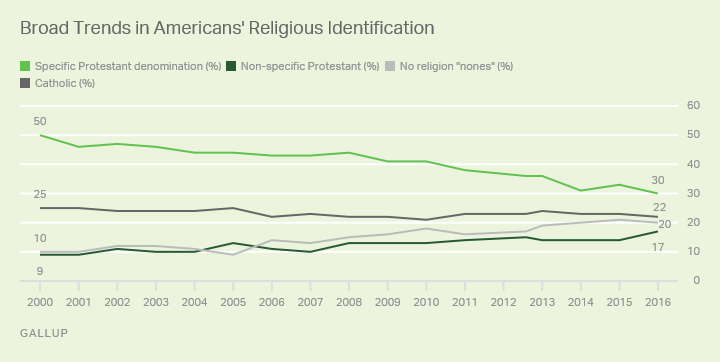
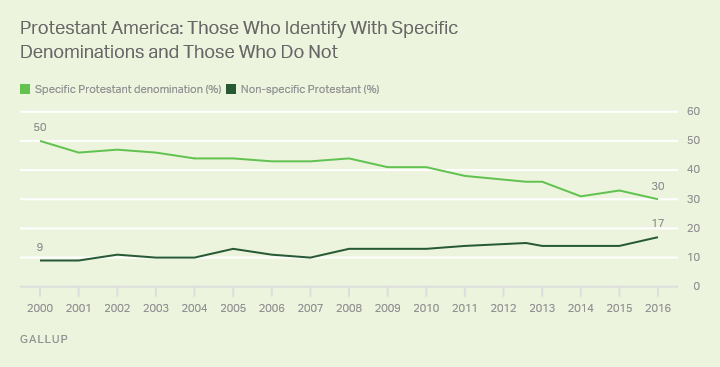
Secondly, Americans who identify as Christians other than Catholics or Mormons increasingly put themselves into a non-denominational category rather than identifying with a specific denomination such as Baptist, Methodist, Lutheran, Episcopalian and so forth. Others simply identify their religion as Christian without any reference to Protestantism or a specific Protestant denomination. As a result of these trends, the percentage of Americans who identify with a specific Protestant denomination has dropped from 50% in 2000 to 30% in 2016, while Christians who don't name a specific religion or denomination have doubled in number, from 9% to 17%.
These data are based on selected Gallup surveys in which Protestants are asked detailed questions about their specific denominational affiliation. The initial question asks, "What is your religious preference -- are you Protestant, Roman Catholic, Mormon, Jewish, Muslim, another religion or no religion?" Those who do not respond with one of these categories are asked, "Would that fall under the general category of Protestant religions, is it a Christian religion, but not Protestant, or is it something else?" Then, all of those who end up in the general category of Protestant are asked, "What specific denomination is that?" The latter question is open-ended and Gallup coders categorize the responses into specific denominations.
Precisely measuring religious identification among Protestants can be challenging, particularly in a telephone survey context. There are hundreds of Protestant denominations in the U.S. today. This allows Protestants to easily switch between denominations, with the result that many Protestants are not as fixed in their religious identity as would be the case for Catholics, Jews or those from other religious traditions. Still, the consistent process Gallup has followed allows for a general comparison of religious identity trends across time.
Baptists Remain the Largest Specific Protestant Denomination
Among those who do have a specific branded Protestant identity, Baptists continue to be the largest denominational group, including 10% of Americans who identify as Baptists as a general category and another 3% who identify as Southern Baptists specifically. The 3% identifying as Southern Baptists has dropped substantially from 8% in 2000. Southern Baptist membership data show that their churches have lost members, and it may also be those who may actually attend an official Southern Baptist church increasingly identify as just "Baptist" rather than as Southern Baptist, specifically.
| Identified | |||||||||||||||||||||||||||||||||||||||||||||||||||||||||||||||||||||||||||||||||||||||||||||||||||
|---|---|---|---|---|---|---|---|---|---|---|---|---|---|---|---|---|---|---|---|---|---|---|---|---|---|---|---|---|---|---|---|---|---|---|---|---|---|---|---|---|---|---|---|---|---|---|---|---|---|---|---|---|---|---|---|---|---|---|---|---|---|---|---|---|---|---|---|---|---|---|---|---|---|---|---|---|---|---|---|---|---|---|---|---|---|---|---|---|---|---|---|---|---|---|---|---|---|---|---|
| % | |||||||||||||||||||||||||||||||||||||||||||||||||||||||||||||||||||||||||||||||||||||||||||||||||||
| Other Baptist | 10 | ||||||||||||||||||||||||||||||||||||||||||||||||||||||||||||||||||||||||||||||||||||||||||||||||||
| Methodist | 4 | ||||||||||||||||||||||||||||||||||||||||||||||||||||||||||||||||||||||||||||||||||||||||||||||||||
| Lutheran | 4 | ||||||||||||||||||||||||||||||||||||||||||||||||||||||||||||||||||||||||||||||||||||||||||||||||||
| Southern Baptist | 3 | ||||||||||||||||||||||||||||||||||||||||||||||||||||||||||||||||||||||||||||||||||||||||||||||||||
| Presbyterian | 2 | ||||||||||||||||||||||||||||||||||||||||||||||||||||||||||||||||||||||||||||||||||||||||||||||||||
| Pentecostal | 2 | ||||||||||||||||||||||||||||||||||||||||||||||||||||||||||||||||||||||||||||||||||||||||||||||||||
| Church of Christ | 1 | ||||||||||||||||||||||||||||||||||||||||||||||||||||||||||||||||||||||||||||||||||||||||||||||||||
| Episcopal | 1 | ||||||||||||||||||||||||||||||||||||||||||||||||||||||||||||||||||||||||||||||||||||||||||||||||||
| Other | 3 | ||||||||||||||||||||||||||||||||||||||||||||||||||||||||||||||||||||||||||||||||||||||||||||||||||
| Gallup | |||||||||||||||||||||||||||||||||||||||||||||||||||||||||||||||||||||||||||||||||||||||||||||||||||
Bottom Line
One of the clearest trends in American religion in the past decade has been the shift away from formal or official religious identity. About one in five Americans now say they have no specific religious identity at all, and fewer Americans today than in 2000 identify with a specific Protestant denomination. This latter trend reflects the increase in non-denominational Protestant churches in America today, and may also reflect a tendency for church leaders to downplay their denominational affiliation in their own local branding.
Protestantism in America today is a unique religious structure. In few other countries do so many different brands or types of a particular broad religion compete with one another for members. Churches that adhere to specific and historical denominational affiliations appear to face the biggest challenge in American Protestantism today. Increasingly, Christian Americans who are not Catholics or Mormons prefer to either identify themselves simply as Christians or attend the increasing number of non-denominational churches that have no formal allegiance to a broader religious structure.
These trends indicate that, while many Americans remain religious in a broad sense and may continue to seek spiritual guidance and community experience, a formal structure in which to do so has become less important.
These data are available in Gallup Analytics.
Survey Methods
Results for the 2016 data are based on telephone interviews conducted May 4-8 and Dec. 7-11, 2016, with a combined random sample of 2,053 adults, aged 18 and older, living in all 50 U.S. states and the District of Columbia. For results based on the total sample of national adults, the margin of sampling error is ±3 percentage points at the 95% confidence level. All reported margins of sampling error include computed design effects for weighting.
Each sample of national adults includes a minimum quota of 70% cellphone respondents and 30% landline respondents, with additional minimum quotas by time zone within region. Landline and cellular telephone numbers are selected using random-digit-dial methods.
Results for other yearly averages are based on Gallup polls conducted by telephone between 2000 and 2015. The precise number of individuals in each yearly average and the methodology of the polls over this time frame vary from year to year. In general, the margin of error for any specific yearly average is approximately ±3 percentage points at the 95% confidence level. All reported margins of sampling error include computed design effects for weighting.

