Americans, Particularly Democrats, Dislike Russia
by Megan Brenan
Story Highlights
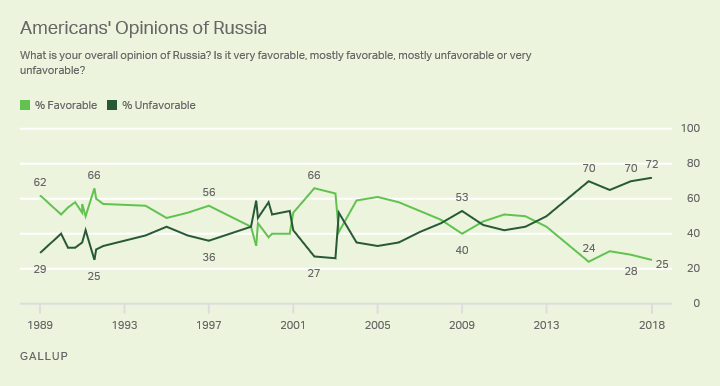
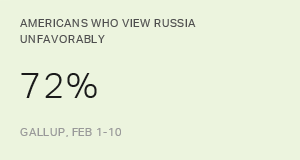
- 72% of Americans view Russia unfavorably, highest in 30 years
- Republicans are twice as likely as Democrats to view Russia favorably
- Younger Americans view Russia more favorably than older Americans
WASHINGTON, D.C. -- As revelations about Russian interference in the 2016
U.S. presidential election continue to develop, Americans now view Russia
more negatively than they have in three decades of Gallup polls. Currently,
25% of Americans have a favorable opinion of Russia and 72% have an unfavorable
opinion, the highest negative reading historically, though statistically
unchanged from last year's 70%. Americans' unfavorable sentiment
toward Russia has been on the rise since Vladimir Putin returned to the
presidency in 2012.
These results are based on Gallup's annual World Affairs poll, conducted
Feb. 1-10, which measured
Americans' opinions of 22 countries and found Russia among those viewed least favorably.
After World War II, the relationship between the U.S. and the Soviet Union
was tense for decades as the Cold War wore on. Relations thawed in the
mid-1980s, and Americans' opinions were largely positive from the
end of the Cold War through the late 1990s. Views of Russia faltered with
the resignation of the country's then-president Boris Yeltsin in 1999.
Americans' perceptions of Russia rebounded in 2001 amid positive dealings
between George W. Bush and President Putin. Opinions were then mixed under
Dmitry Medvedev's presidency, but after Putin reclaimed the presidency
in 2012, Russia's favorability began to sink.
The lowest favorable rating for Russia -- 24% in 2015 -- came amid Russian
interference in Ukraine and parliamentary restrictions on gay and lesbian
rights. The current 25% favorable and 72% unfavorable ratings come as
the U.S. Justice Department continues its investigation into Russian meddling
in the 2016 presidential election and the relationship between Russia
and Trump campaign and administration officials.
Republicans and Younger Adults View Russia More Favorably
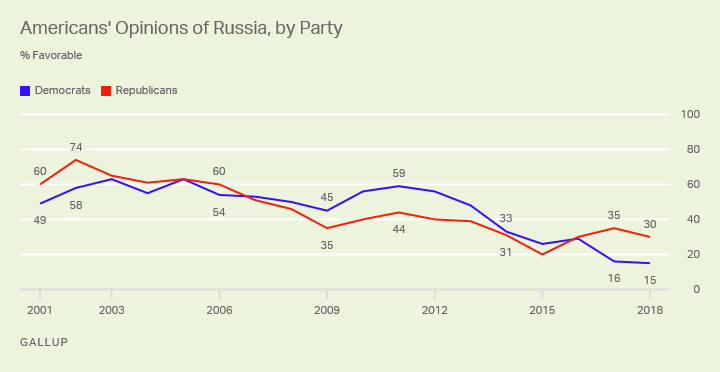
Partisan differences on Russia have varied over the past two decades, with
both Democrats and Republicans at different times holding more positive
views than their counterparts. During the Obama administration, Democrats
viewed Russia more favorably than Republicans. Most recently, as evidence
has mounted suggesting that Russian interference in the 2016 election
was designed to benefit the Trump campaign, Democrats' opinion of
Russia has fallen more sharply than Republicans'. Thirty percent of
Republicans now have a favorable opinion of Russia, compared with 15%
of Democrats.
Americans aged 18 to 29 (32%) are much more likely than those aged 65 and
older (19%) to view Russia favorably. This has been the case
historically in Gallup polls and is likely a result of the fact that younger people did not live through
the Cold War which contributed to shaping older Americans' views of Russia.
Bottom Line
While the U.S.-Russia relationship has been fraught with conflict for decades,
tensions have risen sharply since Putin once again assumed the presidency
in 2012. Americans' opinions of Russia have hit new lows in recent
years. Whereas in the past, partisans have often had similar feelings
about Russia, that is not the case now, as Democrats hold a less positive
view than Republicans do.
As the Justice Department continues its investigation into Russian interference
in the 2016 election, President Trump continues to deny that his campaign
was involved. The outcome of the investigation could further affect Americans'
views of Russia.
Survey Methods
Results for this Gallup poll are based on telephone interviews conducted
Feb. 1-10, 2018, with a random sample of 1,044 adults, aged 18 and older,
living in all 50 U.S. states and the District of Columbia. For results
based on the total sample of national adults, the margin of sampling error
is ±4 percentage points at the 95% confidence level. For results
based on the samples of Republicans, independents and Democrats, the margins
of sampling error are between ±6 and ±8 percentage points
at the 95% confidence level. All reported margins of sampling error include
computed design effects for weighting.
Each sample of national adults includes a minimum quota of 70% cellphone
respondents and 30% landline respondents, with additional minimum quotas
by time zone within region. Landline and cellular telephone numbers are
selected using random-digit-dial methods.
View survey methodology, complete question responses and trends.
Learn more about how the
Gallup Poll Social Series works.


