Still Listening: The State of Telephone Surveys

Since the late 1980s, telephone surveys have been Gallup's primary data collection method for surveying U.S. adults. The survey research field -- and the way people communicate -- has changed a lot since then. Today researchers have a wide range of methodological options available to them in addition to telephone methods, including mail, web, in-person interviewing and text message.
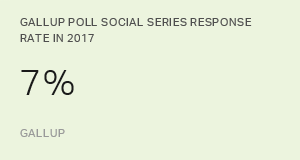
Some of these methods were developed because of the challenges associated with conducting telephone surveys. Although nearly all U.S. adults now have access to a telephone, survey researchers typically achieve relatively low response rates in telephone surveys of the U.S. public. For example, the Gallup Poll Social Series (GPSS) surveys achieved a 7% response rate, on average, in 2017, compared with 28% in 1997. Response rates are calculated according to standards put forth by the Council for American Survey Research Organizations (CASRO) and the American Association for Public Opinion Research (AAPOR) and represent the total number of completed interviews among all eligible households in the sample.

Gallup is not alone. Declining response rates have been reported throughout the survey research industry. The American Association for Public Opinion Research (AAPOR) released response rates from leading survey research firms in its 2015 report, The Future of U.S. General Population Telephone Surveys. The report detailed consistent declines from 2008 to 2015 across all participating organizations. During this period, landline response rates declined from an average of 15.7% to 9.3% and cellphone response rates declined from an average of 11.7% to 7.0%.
It's important to note that response rates themselves are not a measure of survey quality. So long as the final sample of respondents is representative of the entire population, relatively low response rates do not pose a risk to data integrity. Researchers have demonstrated that telephone surveys with low response rates are still able to represent the entire population accurately.
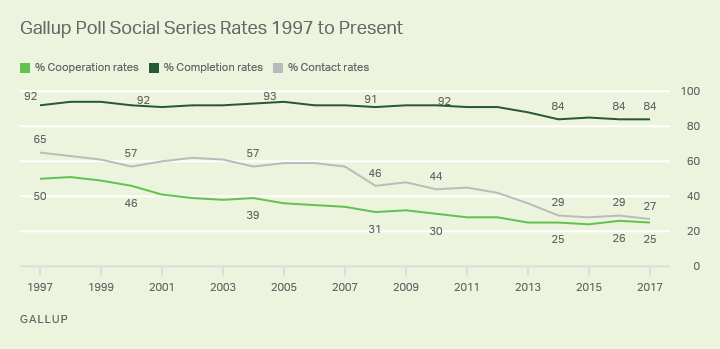
However, lower response rates do mean that researchers are spending significantly more resources to contact and interview individuals by phone. Contact rates -- the percentage of households in the sample who answer the phone -- are declining. While there are many reasons for this decline, some suggest it could reflect changes in how people are using their phones. Phones are being used more for text messaging and browsing the internet and less for answering or making a traditional phone call.
Cooperation rates -- the percentage of respondents who agree to complete the interview at the start of the survey -- have also consistently declined over time. In 1997, the average GPSS cooperation rate was 50%, meaning about half of all respondents who answered the phone agreed to proceed with the interview. In 2017, the average cooperation rate for this study was exactly half that -- 25%. Completion rates -- the percentage of respondents who complete the survey among those who started it -- have also declined, although less precipitously from an average of 92% in 1997 to an average of 84% in 2017.

Applications that block phone numbers on cellphones present a growing challenge to telephone surveys. Mobile applications that allow individuals to report unwanted calls and summarily block them from being received have become more popular with the rise of unwanted sales calls and robocalls. As a single user blocks or reports an unwanted call, the application blocks other users from receiving that call. Gallup and other survey researchers have attempted to combat this issue by changing the outgoing phone number that displays on the respondent's caller ID and by informing respondents of the mission and purpose of the research.
Additionally, because a majority of completed interviews are now conducted with cellphone users (because of the growing percentage of cellphone-only households in the U.S.), these blocking applications significantly increase the cost of conducting a telephone study in the U.S.
Conclusion
Even with the increasing costs associated with telephone work, Gallup continues to interview U.S. adults through its U.S. Gallup Poll via phone and publish regular updates to important political and economic metrics including presidential approval.
Gallup remains committed to conducting surveys by telephone when it's the best methodology to cover the target population properly and meet the research objectives. In some cases, telephone is the only appropriate methodology to conduct a survey of a specific population. When surveys require representative sampling methods and include complex skip patterns, phone may remain the preferred method because respondents often struggle to follow these complicated patterns in self-administered surveys. There are also often times when the only piece of contact information available to a researcher for members of their target population may be a telephone number, making a telephone survey administration the preferred method. In other cases, alternatives that would have been unthinkable even a decade ago are now appropriate for surveys that would have been conducted by phone several years ago.
For many years, Gallup has used other methodologies to survey various populations in the U.S., and worldwide, when appropriate, including mail, in-person and web-based surveys. As response rates in telephone studies have declined rapidly over the last decade and costs increased, Gallup and other leading survey research firms have committed significant time and resources to study and improve upon these other data collection methods.
The decision to conduct a survey by phone or another method remains critical to ensuring that high quality and relevant data are collected. Telephone remains an effective option, but the challenges associated with this method require continual improvement and innovation to telephone data collection, and to other methods, to ensure all members of the target population can effectively and efficiently be heard.
Additional information about telephone response rates:
- Public Opinion Quarterly, Volume 70, Issue 5, 1 January 2006, Pages 759-779, https://doi.org/10.1093/poq/nfl035
