Story Highlights
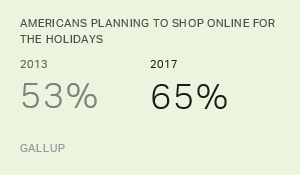
- Online shopping intentions up from 53% to 65% in past four years
- Fewer plan to shop at discount stores, down from 72% to 65%
- Only online shopping has shown growth in past 20 years
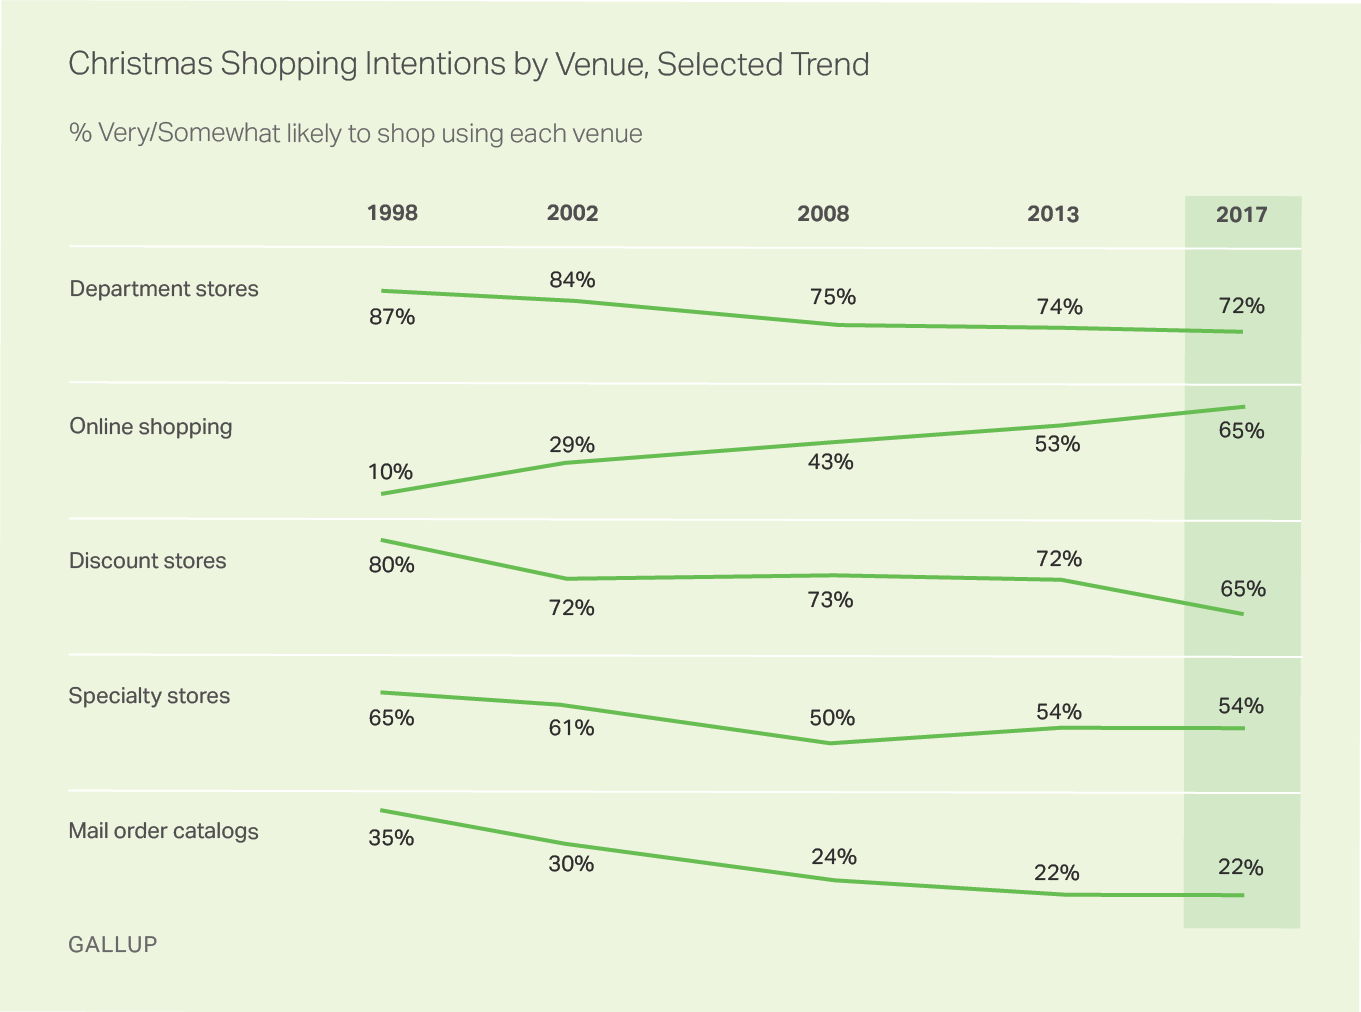
WASHINGTON, D.C. -- Sixty-five percent of U.S. adults say they are likely to shop online for Christmas gifts this year, up 12 percentage points from four years ago and continuing steady growth in this form of shopping over the past two decades. Still, more Americans, 72%, say they are likely to shop at department stores this year, more than any of the other four shopping options tested in the survey.

Since 2013, Americans' intention to shop at discount stores has declined by seven points to 65%, and it is now tied with online shopping. Meanwhile, shopping by the two least-used means -- at specialty stores and via mail order catalogs -- has held steady. Slightly more than half (54%) currently indicate they will shop at specialty stores, defined as those that sell only one type of item, such as toys, clothes or jewelry. A smaller 22% say they plan to shop by mail order catalog.
Longer term, intentions to Christmas shop online have grown, from 10% indicating they were "very" or "somewhat" likely to do so in 1998 to 65% today. As online shopping intentions have increased 55 points over the past 20 years, intentions to shop in other ways all have decreased between 11 and 15 points.
Although online still trails department stores in the overall percentage of Americans saying they are at least somewhat likely to do their holiday shopping there, more Americans now say they are very likely to shop online for Christmas gifts (48%) than say they are very likely to shop at department stores (35%). This indicates a greater probability that Americans will follow through on their intentions to shop online than to shop at department stores.
The current results are based on a Nov. 2-8 poll, updating a question Gallup has asked periodically in holiday seasons since 1993. Online shopping was added to the list in 1998.
Age, Income Related to Holiday Shopping Choices
Where Americans plan to shop for Christmas is related to their age, annual household income and whether they have young children.
| Department stores | Online shopping | Discount stores | Specialty stores | Mail order catalogs | ||||||||||||||||||||||||||||||||||||||||||||||||||||||||||||||||||||||||||||||||||||||||||||||||
|---|---|---|---|---|---|---|---|---|---|---|---|---|---|---|---|---|---|---|---|---|---|---|---|---|---|---|---|---|---|---|---|---|---|---|---|---|---|---|---|---|---|---|---|---|---|---|---|---|---|---|---|---|---|---|---|---|---|---|---|---|---|---|---|---|---|---|---|---|---|---|---|---|---|---|---|---|---|---|---|---|---|---|---|---|---|---|---|---|---|---|---|---|---|---|---|---|---|---|---|---|
| % | % | % | % | % | ||||||||||||||||||||||||||||||||||||||||||||||||||||||||||||||||||||||||||||||||||||||||||||||||
| U.S. adults | 72 | 65 | 65 | 54 | 22 | |||||||||||||||||||||||||||||||||||||||||||||||||||||||||||||||||||||||||||||||||||||||||||||||
| Age | ||||||||||||||||||||||||||||||||||||||||||||||||||||||||||||||||||||||||||||||||||||||||||||||||||||
| 18-29 | 75 | 76 | 67 | 67 | 14 | |||||||||||||||||||||||||||||||||||||||||||||||||||||||||||||||||||||||||||||||||||||||||||||||
| 30-49 | 73 | 73 | 67 | 58 | 17 | |||||||||||||||||||||||||||||||||||||||||||||||||||||||||||||||||||||||||||||||||||||||||||||||
| 50-64 | 71 | 61 | 67 | 51 | 28 | |||||||||||||||||||||||||||||||||||||||||||||||||||||||||||||||||||||||||||||||||||||||||||||||
| 65+ | 63 | 47 | 59 | 34 | 31 | |||||||||||||||||||||||||||||||||||||||||||||||||||||||||||||||||||||||||||||||||||||||||||||||
| Household income | ||||||||||||||||||||||||||||||||||||||||||||||||||||||||||||||||||||||||||||||||||||||||||||||||||||
| $75,000+ | 77 | 86 | 61 | 66 | 26 | |||||||||||||||||||||||||||||||||||||||||||||||||||||||||||||||||||||||||||||||||||||||||||||||
| $30,000-$74,999 | 70 | 64 | 65 | 48 | 22 | |||||||||||||||||||||||||||||||||||||||||||||||||||||||||||||||||||||||||||||||||||||||||||||||
| <$30,000 | 63 | 40 | 72 | 42 | 17 | |||||||||||||||||||||||||||||||||||||||||||||||||||||||||||||||||||||||||||||||||||||||||||||||
| Children under 18 | ||||||||||||||||||||||||||||||||||||||||||||||||||||||||||||||||||||||||||||||||||||||||||||||||||||
| Yes | 73 | 67 | 71 | 66 | 22 | |||||||||||||||||||||||||||||||||||||||||||||||||||||||||||||||||||||||||||||||||||||||||||||||
| No | 70 | 65 | 63 | 47 | 23 | |||||||||||||||||||||||||||||||||||||||||||||||||||||||||||||||||||||||||||||||||||||||||||||||
| Full item wording for online shopping: "Online shopping on the internet, using a computer, smartphone or tablet." Full item wording for specialty stores: "Specialty stores, such as stores that sell only toys, or only clothes, or only jewelry, for example." | ||||||||||||||||||||||||||||||||||||||||||||||||||||||||||||||||||||||||||||||||||||||||||||||||||||
| Gallup, Nov. 2-8, 2017 | ||||||||||||||||||||||||||||||||||||||||||||||||||||||||||||||||||||||||||||||||||||||||||||||||||||
Some of the key differences by subgroup are:
- The top-ranked holiday shopping venue differs by income group. Among upper-income Americans, it is online shopping. For middle-income Americans, it is department stores; for lower-income Americans, it is discount stores.
- Upper-income Americans are much more likely than middle- or lower-income Americans to say they will shop online for holiday gifts, and to visit specialty stores.
- There has been no change in lower-income Americans' intentions to shop at discount stores since 2013; the percentage was also 72% four years ago. But upper- and middle-income consumers are less likely to plan to shop at discount stores now than in 2013 (then 68% and 73%, respectively).
- As might be expected, younger consumers are more likely than older ones to plan to use the internet for holiday shopping -- roughly three-quarters of adults younger than 50 will shop online, compared with six in 10 between the ages of 50 and 64 and less than half of senior citizens.
- Younger adults also are more likely to say they plan to shop at specialty stores than older Americans are.
- Seniors tend to be less likely than younger adults to shop online and at all types of stores, but are the age group most likely to use mail order catalogs.
- Parents who have young children are much more likely than all other adults to shop at specialty stores, presumably at toy stores or electronics stores to buy gifts for their children.


