Record Few Americans Believe Bible Is Literal Word of God

Story Highlights
- 24% believe Bible is literal word of God, the lowest in Gallup's 40-year trend
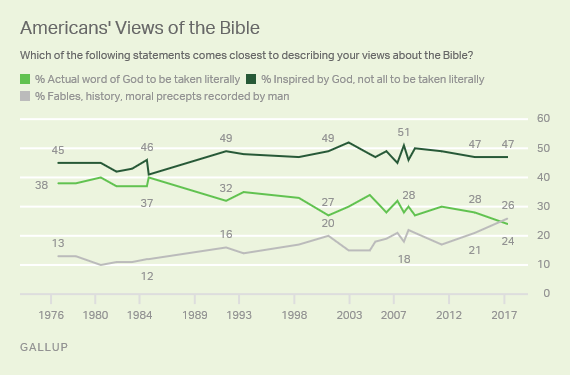
- View of Bible as secular stories and history at 26%, up from 21% in 2014
- The largest segment, 47%, still think Bible is inspired word of God
WASHINGTON, D.C. -- Fewer than one in four Americans (24%) now believe the Bible is "the actual word of God, and is to be taken literally, word for word," similar to the 26% who view it as "a book of fables, legends, history and moral precepts recorded by man." This is the first time in Gallup's four-decade trend that biblical literalism has not surpassed biblical skepticism. Meanwhile, about half of Americans -- a proportion largely unchanged over the years -- fall in the middle, saying the Bible is the inspired word of God but that not all of it should be taken literally.

From the mid-1970s through 1984, close to 40% of Americans considered the Bible the literal word of God, but this has been declining ever since, along with a shrinking percentage of self-identified Christians in the U.S. Meanwhile, the percentage defining the Bible as mere stories has doubled, with much of that change occurring in the past three years.
Still, while biblical literalism has waned, the vast majority of Americans -- 71% -- continue to view the Bible as a holy document, believing it is at least God-inspired if not God's own words.
The latest results are based on Gallup's annual Values and Beliefs poll, conducted May 3-7.
Literalists Still Outnumber Skeptics Among Certain Groups
Although biblical literalism now ties with biblical skepticism nationally, these views vary somewhat across different segments of the U.S. population.
Nonwhites, adults aged 50 and older, and adults with no college education all lean toward believing the Bible is the actual word of God rather than stories and history recorded by man.
Men, whites, adults aged 18 to 29 as well as those aged 30 to 49, and college graduates lean in the other direction, with more being skeptics than literalists. Still, in all of these groups, the largest segment takes the middle position, believing the Bible reflects the inspired word of God.
Naturally, there are also strong differences in Americans' perspectives on the Bible by religious preference. As a whole, more Christians take the Bible literally than say it is a book of stories and history recorded by man. However, within the broad group of Christians, Protestants (including those who generically refer to themselves as "Christian") lean toward the literalist view, while Catholics divide evenly between seeing the Bible as the literal word of God and saying it is a book of stories. Not surprisingly, the vast majority of those with no religious affiliation fall into the skeptics' camp.
| Actual word of God | Inspired word of God | Ancient book of fables | |||||||||||||||||||||||||||||||||||||||||||||||||||||||||||||||||||||||||||||||||||||||||||||||||
|---|---|---|---|---|---|---|---|---|---|---|---|---|---|---|---|---|---|---|---|---|---|---|---|---|---|---|---|---|---|---|---|---|---|---|---|---|---|---|---|---|---|---|---|---|---|---|---|---|---|---|---|---|---|---|---|---|---|---|---|---|---|---|---|---|---|---|---|---|---|---|---|---|---|---|---|---|---|---|---|---|---|---|---|---|---|---|---|---|---|---|---|---|---|---|---|---|---|---|---|
| % | % | % | |||||||||||||||||||||||||||||||||||||||||||||||||||||||||||||||||||||||||||||||||||||||||||||||||
| U.S. adults | 24 | 47 | 26 | ||||||||||||||||||||||||||||||||||||||||||||||||||||||||||||||||||||||||||||||||||||||||||||||||
| Men | 23 | 46 | 30 | ||||||||||||||||||||||||||||||||||||||||||||||||||||||||||||||||||||||||||||||||||||||||||||||||
| Women | 26 | 48 | 24 | ||||||||||||||||||||||||||||||||||||||||||||||||||||||||||||||||||||||||||||||||||||||||||||||||
| Whites | 22 | 48 | 28 | ||||||||||||||||||||||||||||||||||||||||||||||||||||||||||||||||||||||||||||||||||||||||||||||||
| Nonwhites | 29 | 46 | 23 | ||||||||||||||||||||||||||||||||||||||||||||||||||||||||||||||||||||||||||||||||||||||||||||||||
| 18 to 29 | 12 | 54 | 30 | ||||||||||||||||||||||||||||||||||||||||||||||||||||||||||||||||||||||||||||||||||||||||||||||||
| 30 to 49 | 24 | 40 | 33 | ||||||||||||||||||||||||||||||||||||||||||||||||||||||||||||||||||||||||||||||||||||||||||||||||
| 50 to 64 | 31 | 49 | 19 | ||||||||||||||||||||||||||||||||||||||||||||||||||||||||||||||||||||||||||||||||||||||||||||||||
| 65+ | 27 | 49 | 22 | ||||||||||||||||||||||||||||||||||||||||||||||||||||||||||||||||||||||||||||||||||||||||||||||||
| College graduate | 13 | 50 | 36 | ||||||||||||||||||||||||||||||||||||||||||||||||||||||||||||||||||||||||||||||||||||||||||||||||
| Some college | 27 | 44 | 26 | ||||||||||||||||||||||||||||||||||||||||||||||||||||||||||||||||||||||||||||||||||||||||||||||||
| No college | 31 | 47 | 19 | ||||||||||||||||||||||||||||||||||||||||||||||||||||||||||||||||||||||||||||||||||||||||||||||||
| Total Christian | 30 | 54 | 14 | ||||||||||||||||||||||||||||||||||||||||||||||||||||||||||||||||||||||||||||||||||||||||||||||||
| Protestant/Other Christian | 35 | 51 | 12 | ||||||||||||||||||||||||||||||||||||||||||||||||||||||||||||||||||||||||||||||||||||||||||||||||
| Catholic | 21 | 58 | 19 | ||||||||||||||||||||||||||||||||||||||||||||||||||||||||||||||||||||||||||||||||||||||||||||||||
| No religion | 7 | 21 | 68 | ||||||||||||||||||||||||||||||||||||||||||||||||||||||||||||||||||||||||||||||||||||||||||||||||
| Religion very important | 41 | 50 | 7 | ||||||||||||||||||||||||||||||||||||||||||||||||||||||||||||||||||||||||||||||||||||||||||||||||
| Religion fairly important | 13 | 66 | 17 | ||||||||||||||||||||||||||||||||||||||||||||||||||||||||||||||||||||||||||||||||||||||||||||||||
| Religion not important | 2 | 20 | 76 | ||||||||||||||||||||||||||||||||||||||||||||||||||||||||||||||||||||||||||||||||||||||||||||||||
| Gallup, May 3-7, 2017 | |||||||||||||||||||||||||||||||||||||||||||||||||||||||||||||||||||||||||||||||||||||||||||||||||||
Notably, in 1976, some of the same groups -- older Americans and Protestants, along with women, were more inclined than their counterparts toward biblical literalism. Since then, this belief has fallen by double digits among every group, but it is down the most on a proportional basis among young adults -- falling by more than half, from 32% to 12%.
| 1976 | 2017 | ||||||||||||||||||||||||||||||||||||||||||||||||||||||||||||||||||||||||||||||||||||||||||||||||||
|---|---|---|---|---|---|---|---|---|---|---|---|---|---|---|---|---|---|---|---|---|---|---|---|---|---|---|---|---|---|---|---|---|---|---|---|---|---|---|---|---|---|---|---|---|---|---|---|---|---|---|---|---|---|---|---|---|---|---|---|---|---|---|---|---|---|---|---|---|---|---|---|---|---|---|---|---|---|---|---|---|---|---|---|---|---|---|---|---|---|---|---|---|---|---|---|---|---|---|---|
| % | % | ||||||||||||||||||||||||||||||||||||||||||||||||||||||||||||||||||||||||||||||||||||||||||||||||||
| U.S. adults | 38 | 24 | |||||||||||||||||||||||||||||||||||||||||||||||||||||||||||||||||||||||||||||||||||||||||||||||||
| Men | 33 | 23 | |||||||||||||||||||||||||||||||||||||||||||||||||||||||||||||||||||||||||||||||||||||||||||||||||
| Women | 41 | 26 | |||||||||||||||||||||||||||||||||||||||||||||||||||||||||||||||||||||||||||||||||||||||||||||||||
| 18 to 29 | 32 | 12 | |||||||||||||||||||||||||||||||||||||||||||||||||||||||||||||||||||||||||||||||||||||||||||||||||
| 30 to 49 | 34 | 24 | |||||||||||||||||||||||||||||||||||||||||||||||||||||||||||||||||||||||||||||||||||||||||||||||||
| 50+ | 45 | 29 | |||||||||||||||||||||||||||||||||||||||||||||||||||||||||||||||||||||||||||||||||||||||||||||||||
| Protestant/Other Christian | 46 | 35 | |||||||||||||||||||||||||||||||||||||||||||||||||||||||||||||||||||||||||||||||||||||||||||||||||
| Catholic | 31 | 21 | |||||||||||||||||||||||||||||||||||||||||||||||||||||||||||||||||||||||||||||||||||||||||||||||||
| None | n/a | 7 | |||||||||||||||||||||||||||||||||||||||||||||||||||||||||||||||||||||||||||||||||||||||||||||||||
| Gallup | |||||||||||||||||||||||||||||||||||||||||||||||||||||||||||||||||||||||||||||||||||||||||||||||||||
Bottom Line
Over the past three decades, Americans' view of the Bible as the literal word of God has been declining, while their view that the Bible is a collection of fables, myths and history recorded by man has been increasing. The shift is most pronounced among young adults, indicating the trend is likely to accelerate in the years ahead.
Americans in all age groups still largely accept the Bible as a holy document, but most of these downplay God's direct role in it. That could mean people are more willing than in the past to believe it is open to interpretation -- if man, not God, wrote the Bible, more can be questioned. And that, in turn, may have consequences for where Americans come down on a number of morally tinged issues. The country may already be seeing this in growing public acceptance of a variety of behaviors that were once largely frowned on from a Christian perspective -- ranging from gay marriage and premarital sex to out-of-wedlock births and physician-assisted suicide.
Historical data are available in Gallup Analytics.
Survey Methods
Results for this Gallup poll are based on telephone interviews conducted May 3-7, 2017, with a random sample of 1,011 adults, aged 18 and older, living in all 50 U.S. states and the District of Columbia. For results based on the total sample of national adults, the margin of sampling error is ±4 percentage points at the 95% confidence level. All reported margins of sampling error include computed design effects for weighting.
Each sample of national adults includes a minimum quota of 70% cellphone respondents and 30% landline respondents, with additional minimum quotas by time zone within region. Landline and cellular telephone numbers are selected using random-digit-dial methods.
View survey methodology, complete question responses and trends.
Learn more about how the Gallup Poll Social Series works.
