Story Highlights
- 8% say it is "very" or "fairly" likely they will be laid off this year
- Down from 15% one year ago and peak of 21% in 2010
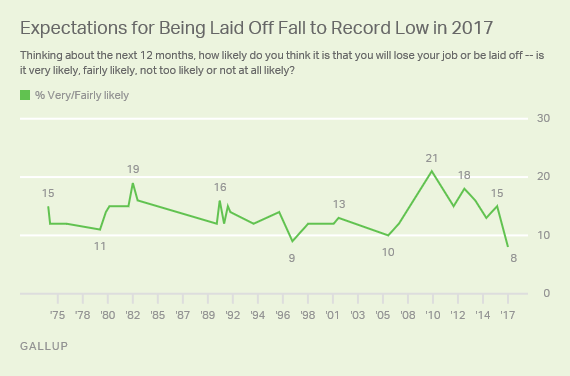
WASHINGTON, D.C. -- American workers are less concerned about being laid off in the coming year than they have been in at least four decades. The current 8% of full- or part-time employees who say they are "very" or "fairly" likely to be laid off in the next 12 months is, by one percentage point, the lowest Gallup has recorded since first asking the question in 1975.

The latest figure comes from Gallup's annual Economy and Personal Finances poll, conducted April 5-9. This year's poll was conducted as the U.S. unemployment rate dipped to 4.5%, its lowest point in nearly a decade, and as workers report increased hiring at their workplaces. Gallup began asking the "fear of being laid off" question in 1975 and has updated it periodically since then, but has asked it annually since 2012.
Across the 42-year span in which Gallup has asked this question, an average of 14% have said they are "very" or "fairly" likely to be laid off, but concerns about layoffs have reached as high as 21% in 2010 as unemployment approached double digits after the Great Recession.
The current 8% of employees who say it is "very" or "fairly" likely they will be laid off this year is down seven points from one year ago. U.S. workers are much more likely to say it's "not too likely" they'll be laid off (29%). The majority, 62%, say it is "not likely at all."
The full trend and responses are shown at the end of the article.
It is not clear from the historical trend how greatly partisan considerations factor into workers' assessments of their job security. However, the percentage of employed adults who are Republicans or Republican-leaning independents are now less likely than they were in 2016 to say it is likely they will be laid off this year. There has not been a meaningful change among workers who are Democrats or Democratic-leaning independents.
Bottom Line
Roughly one in 12 U.S. workers harbor some concern they could be laid off in the coming year, but that's down from around one in seven last year and around one in five in 2010.
Improvements in the overall job market -- based on government statistics and Gallup measures of hiring at workers' places of employment -- have likely reduced workers' concerns about layoffs. In addition to reporting more hiring at their workplaces, U.S. workers are more confident in the economy and are generally spending more.
With employees reporting greater job stability and a majority of Americans saying it is a good time to find a quality job, a shift in the employer-employee dynamic could be taking place -- giving workers the upper hand while forcing employers to compete for top talent.
Historical data are available in Gallup Analytics.
Survey Methods
Results for this Gallup poll are based on telephone interviews conducted April 5-9, 2017, with a random sample of 547 full-time or part-time employees, aged 18 and older, living in all 50 U.S. states and the District of Columbia. For results based on the sample of full-time or part-time employees, the margin of sampling error is ±5 percentage points at the 95% confidence level. All reported margins of sampling error include computed design effects for weighting.
Each sample of national adults includes a minimum quota of 70% cellphone respondents and 30% landline respondents, with additional minimum quotas by time zone within region. Landline and cellular telephone numbers are selected using random-digit-dial methods.
View survey methodology, complete question responses and trends.
Learn more about how the Gallup Poll Social Series works.
| Very likely | Fairly likely | Not too likely | Not at all likely | ||||||||||||||||||||||||||||||||||||||||||||||||||||||||||||||||||||||||||||||||||||||||||||||||
|---|---|---|---|---|---|---|---|---|---|---|---|---|---|---|---|---|---|---|---|---|---|---|---|---|---|---|---|---|---|---|---|---|---|---|---|---|---|---|---|---|---|---|---|---|---|---|---|---|---|---|---|---|---|---|---|---|---|---|---|---|---|---|---|---|---|---|---|---|---|---|---|---|---|---|---|---|---|---|---|---|---|---|---|---|---|---|---|---|---|---|---|---|---|---|---|---|---|---|---|
| % | % | % | % | ||||||||||||||||||||||||||||||||||||||||||||||||||||||||||||||||||||||||||||||||||||||||||||||||
| 2017 Apr 5-9 | 4 | 4 | 29 | 62 | |||||||||||||||||||||||||||||||||||||||||||||||||||||||||||||||||||||||||||||||||||||||||||||||
| 2016 Apr 6-10 | 8 | 7 | 32 | 53 | |||||||||||||||||||||||||||||||||||||||||||||||||||||||||||||||||||||||||||||||||||||||||||||||
| 2015 Apr 9-12 | 5 | 8 | 34 | 52 | |||||||||||||||||||||||||||||||||||||||||||||||||||||||||||||||||||||||||||||||||||||||||||||||
| 2014 Apr 3-6 | 5 | 11 | 34 | 50 | |||||||||||||||||||||||||||||||||||||||||||||||||||||||||||||||||||||||||||||||||||||||||||||||
| 2013 Apr 4-7 | 6 | 12 | 35 | 45 | |||||||||||||||||||||||||||||||||||||||||||||||||||||||||||||||||||||||||||||||||||||||||||||||
| 2012 Apr 9-12 | 5 | 10 | 42 | 42 | |||||||||||||||||||||||||||||||||||||||||||||||||||||||||||||||||||||||||||||||||||||||||||||||
| 2010 Apr 8-11 | 8 | 13 | 40 | 38 | |||||||||||||||||||||||||||||||||||||||||||||||||||||||||||||||||||||||||||||||||||||||||||||||
| 2007 Apr 2-5 | 4 | 8 | 31 | 57 | |||||||||||||||||||||||||||||||||||||||||||||||||||||||||||||||||||||||||||||||||||||||||||||||
| 2006 Apr 10-13 | 3 | 7 | 32 | 57 | |||||||||||||||||||||||||||||||||||||||||||||||||||||||||||||||||||||||||||||||||||||||||||||||
| 2001 Sep 21-22 | 7 | 6 | 25 | 62 | |||||||||||||||||||||||||||||||||||||||||||||||||||||||||||||||||||||||||||||||||||||||||||||||
| 2001 Apr 6-8 | 5 | 7 | 36 | 52 | |||||||||||||||||||||||||||||||||||||||||||||||||||||||||||||||||||||||||||||||||||||||||||||||
| 1998 Dec 4-6 | 5 | 7 | 27 | 60 | |||||||||||||||||||||||||||||||||||||||||||||||||||||||||||||||||||||||||||||||||||||||||||||||
| 1997 Jun 26-29 | 3 | 6 | 26 | 63 | |||||||||||||||||||||||||||||||||||||||||||||||||||||||||||||||||||||||||||||||||||||||||||||||
| 1996 Apr 9-10 | 5 | 9 | 34 | 51 | |||||||||||||||||||||||||||||||||||||||||||||||||||||||||||||||||||||||||||||||||||||||||||||||
| 1993 Dec 4-6 | 5 | 7 | 27 | 59 | |||||||||||||||||||||||||||||||||||||||||||||||||||||||||||||||||||||||||||||||||||||||||||||||
| 1991 Oct 17-20 | 6 | 8 | 26 | 59 | |||||||||||||||||||||||||||||||||||||||||||||||||||||||||||||||||||||||||||||||||||||||||||||||
| 1991 Jul 25-28 | 5 | 10 | 25 | 59 | |||||||||||||||||||||||||||||||||||||||||||||||||||||||||||||||||||||||||||||||||||||||||||||||
| 1991 Mar 21-24 | 5 | 7 | 22 | 65 | |||||||||||||||||||||||||||||||||||||||||||||||||||||||||||||||||||||||||||||||||||||||||||||||
| 1990 Oct 25-28 | 7 | 9 | 21 | 62 | |||||||||||||||||||||||||||||||||||||||||||||||||||||||||||||||||||||||||||||||||||||||||||||||
| 1990 Jul 19-22 | 6 | 6 | 24 | 62 | |||||||||||||||||||||||||||||||||||||||||||||||||||||||||||||||||||||||||||||||||||||||||||||||
| 1983 Apr 15-18 | 8 | 8 | 26 | 55 | |||||||||||||||||||||||||||||||||||||||||||||||||||||||||||||||||||||||||||||||||||||||||||||||
| 1982 Nov 5-8 | 9 | 10 | 29 | 48 | |||||||||||||||||||||||||||||||||||||||||||||||||||||||||||||||||||||||||||||||||||||||||||||||
| 1982 Jun 11-14 | 8 | 7 | 27 | 54 | |||||||||||||||||||||||||||||||||||||||||||||||||||||||||||||||||||||||||||||||||||||||||||||||
| 1982 Jan 22-25 | 5 | 10 | 25 | 57 | |||||||||||||||||||||||||||||||||||||||||||||||||||||||||||||||||||||||||||||||||||||||||||||||
| 1980 Sep 12-15 | 6 | 9 | 24 | 60 | |||||||||||||||||||||||||||||||||||||||||||||||||||||||||||||||||||||||||||||||||||||||||||||||
| 1980 May 16-19 | 6 | 8 | 24 | 60 | |||||||||||||||||||||||||||||||||||||||||||||||||||||||||||||||||||||||||||||||||||||||||||||||
| 1979 Nov 2-5 | 3 | 8 | 18 | 66 | |||||||||||||||||||||||||||||||||||||||||||||||||||||||||||||||||||||||||||||||||||||||||||||||
| 1976 Oct 8-11 | 6 | 6 | 21 | 64 | |||||||||||||||||||||||||||||||||||||||||||||||||||||||||||||||||||||||||||||||||||||||||||||||
| 1975 Apr 4-7 | 4 | 8 | 22 | 63 | |||||||||||||||||||||||||||||||||||||||||||||||||||||||||||||||||||||||||||||||||||||||||||||||
| 1975 Jan 31-Feb 3 | 5 | 10 | 27 | 54 | |||||||||||||||||||||||||||||||||||||||||||||||||||||||||||||||||||||||||||||||||||||||||||||||
| Asked of U.S. adults who work full time or part time | |||||||||||||||||||||||||||||||||||||||||||||||||||||||||||||||||||||||||||||||||||||||||||||||||||
| GALLUP | |||||||||||||||||||||||||||||||||||||||||||||||||||||||||||||||||||||||||||||||||||||||||||||||||||


