Story Highlights
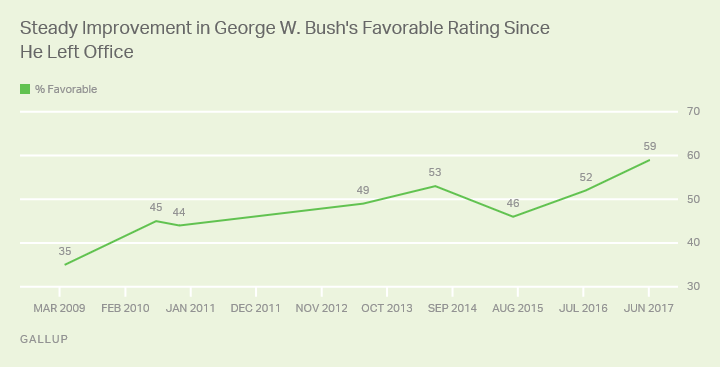
- 59% of Americans now view Bush favorably, up from 52% a year ago
- Bush's ratings up across the board, except for young adults
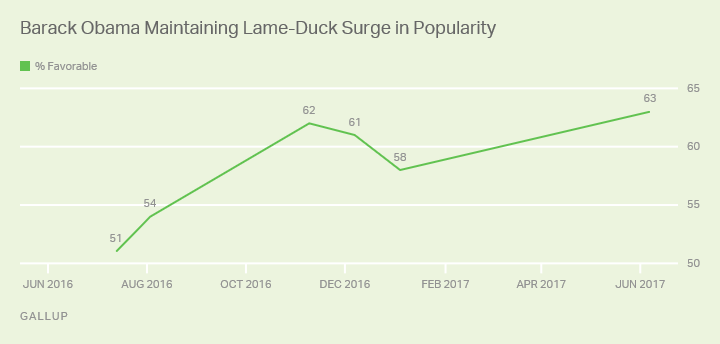
- Obama enjoys initial 63% favorable rating in retirement
WASHINGTON, D.C. -- Former President George W. Bush's national image continues to improve in his retirement, with his favorable rating rising seven percentage points over the past year to 59%. This continues the fairly steady improvement in Bush's favorable rating since it registered a meager 35% at the start of his post-presidential years in March 2009.

Bush's favorability now approaches that of former President Barack Obama, who measured at 63% in the same poll, conducted June 7-11.
Over the past year, Bush's image has improved, and to a similar degree, among nearly all major demographic and political groups. One exception is young adults, among whom his favorable rating is unchanged and well below the national average, at 42%.
Compared with Bush's post-presidential low point in 2009, his favorable rating has nearly doubled among political independents to 56% and has increased fourfold among Democrats to 41%. His already positive 72% rating from Republicans in 2009 has improved less, registering 82% today.
| March 2009 | July 2016 | June 2017 | ||||||||||||||||||||||||||||||||||||||||||||||||||||||||||||||||||||||||||||||||||||||||||||||||||
|---|---|---|---|---|---|---|---|---|---|---|---|---|---|---|---|---|---|---|---|---|---|---|---|---|---|---|---|---|---|---|---|---|---|---|---|---|---|---|---|---|---|---|---|---|---|---|---|---|---|---|---|---|---|---|---|---|---|---|---|---|---|---|---|---|---|---|---|---|---|---|---|---|---|---|---|---|---|---|---|---|---|---|---|---|---|---|---|---|---|---|---|---|---|---|---|---|---|---|---|---|
| % | % | % | ||||||||||||||||||||||||||||||||||||||||||||||||||||||||||||||||||||||||||||||||||||||||||||||||||
| U.S. adults | 35 | 52 | 59 | |||||||||||||||||||||||||||||||||||||||||||||||||||||||||||||||||||||||||||||||||||||||||||||||||
| Gender | ||||||||||||||||||||||||||||||||||||||||||||||||||||||||||||||||||||||||||||||||||||||||||||||||||||
| Men | 33 | 50 | 56 | |||||||||||||||||||||||||||||||||||||||||||||||||||||||||||||||||||||||||||||||||||||||||||||||||
| Women | 36 | 54 | 60 | |||||||||||||||||||||||||||||||||||||||||||||||||||||||||||||||||||||||||||||||||||||||||||||||||
| Race | ||||||||||||||||||||||||||||||||||||||||||||||||||||||||||||||||||||||||||||||||||||||||||||||||||||
| White | 37 | 58 | 64 | |||||||||||||||||||||||||||||||||||||||||||||||||||||||||||||||||||||||||||||||||||||||||||||||||
| Nonwhite | 26 | 39 | 47 | |||||||||||||||||||||||||||||||||||||||||||||||||||||||||||||||||||||||||||||||||||||||||||||||||
| Age | ||||||||||||||||||||||||||||||||||||||||||||||||||||||||||||||||||||||||||||||||||||||||||||||||||||
| 18 to 34 | 27 | 42 | 42 | |||||||||||||||||||||||||||||||||||||||||||||||||||||||||||||||||||||||||||||||||||||||||||||||||
| 35 to 54 | 37 | 57 | 64 | |||||||||||||||||||||||||||||||||||||||||||||||||||||||||||||||||||||||||||||||||||||||||||||||||
| 55+ | 37 | 56 | 65 | |||||||||||||||||||||||||||||||||||||||||||||||||||||||||||||||||||||||||||||||||||||||||||||||||
| Party ID | ||||||||||||||||||||||||||||||||||||||||||||||||||||||||||||||||||||||||||||||||||||||||||||||||||||
| Republicans | 72 | 75 | 82 | |||||||||||||||||||||||||||||||||||||||||||||||||||||||||||||||||||||||||||||||||||||||||||||||||
| Independents | 29 | 49 | 56 | |||||||||||||||||||||||||||||||||||||||||||||||||||||||||||||||||||||||||||||||||||||||||||||||||
| Democrats | 10 | 33 | 41 | |||||||||||||||||||||||||||||||||||||||||||||||||||||||||||||||||||||||||||||||||||||||||||||||||
| Gallup | ||||||||||||||||||||||||||||||||||||||||||||||||||||||||||||||||||||||||||||||||||||||||||||||||||||
Bush's favorability was higher than 59% at various points during his first term, reaching 87% shortly after 9/11. It fell to a personal low of 32% in April 2008, at the same time his job approval rating first fell below 30% under mounting concerns about the economy and ongoing Iraq War.
Obama Favorable Rating Steady at Post-Election High
Obama's current 63% favorable rating is similar to what Gallup measured during the lame-duck period of his presidency, from mid-November 2016 through January 2017. Those ratings represented an improvement from what Gallup found for most of his two terms, including a 54% favorable rating last August, the last measurement before Americans chose his successor in the 2016 election.

Obama's presidential high point of 69% favorable was his very first reading, in March 2009. His low point was 42%, immediately after the 2014 midterm elections when Republicans made major gains in both houses of Congress as well as in state governorships and legislative seats across the country.
Unlike Bush, who still fails to win majority approval from young adults, Obama is viewed favorably by all major demographic groups, including men, women, whites, nonwhites and all age categories.
Only on the basis of politics does Obama run into difficulty, with just 22% of Republicans viewing him favorably. However, he has an extraordinary 95% favorable rating from Democrats, well exceeding Bush's 82% favorable from Republicans.
| June 2017 | ||||||||||||||||||||||||||||||||||||||||||||||||||||||||||||||||||||||||||||||||||||||||||||||||||||
|---|---|---|---|---|---|---|---|---|---|---|---|---|---|---|---|---|---|---|---|---|---|---|---|---|---|---|---|---|---|---|---|---|---|---|---|---|---|---|---|---|---|---|---|---|---|---|---|---|---|---|---|---|---|---|---|---|---|---|---|---|---|---|---|---|---|---|---|---|---|---|---|---|---|---|---|---|---|---|---|---|---|---|---|---|---|---|---|---|---|---|---|---|---|---|---|---|---|---|---|---|
| % | ||||||||||||||||||||||||||||||||||||||||||||||||||||||||||||||||||||||||||||||||||||||||||||||||||||
| U.S. adults | 63 | |||||||||||||||||||||||||||||||||||||||||||||||||||||||||||||||||||||||||||||||||||||||||||||||||||
| Gender | ||||||||||||||||||||||||||||||||||||||||||||||||||||||||||||||||||||||||||||||||||||||||||||||||||||
| Men | 60 | |||||||||||||||||||||||||||||||||||||||||||||||||||||||||||||||||||||||||||||||||||||||||||||||||||
| Women | 66 | |||||||||||||||||||||||||||||||||||||||||||||||||||||||||||||||||||||||||||||||||||||||||||||||||||
| Race | ||||||||||||||||||||||||||||||||||||||||||||||||||||||||||||||||||||||||||||||||||||||||||||||||||||
| White | 55 | |||||||||||||||||||||||||||||||||||||||||||||||||||||||||||||||||||||||||||||||||||||||||||||||||||
| Nonwhite | 82 | |||||||||||||||||||||||||||||||||||||||||||||||||||||||||||||||||||||||||||||||||||||||||||||||||||
| Age | ||||||||||||||||||||||||||||||||||||||||||||||||||||||||||||||||||||||||||||||||||||||||||||||||||||
| 18 to 34 | 75 | |||||||||||||||||||||||||||||||||||||||||||||||||||||||||||||||||||||||||||||||||||||||||||||||||||
| 35 to 54 | 62 | |||||||||||||||||||||||||||||||||||||||||||||||||||||||||||||||||||||||||||||||||||||||||||||||||||
| 55+ | 55 | |||||||||||||||||||||||||||||||||||||||||||||||||||||||||||||||||||||||||||||||||||||||||||||||||||
| Party ID | ||||||||||||||||||||||||||||||||||||||||||||||||||||||||||||||||||||||||||||||||||||||||||||||||||||
| Republicans | 22 | |||||||||||||||||||||||||||||||||||||||||||||||||||||||||||||||||||||||||||||||||||||||||||||||||||
| Independents | 65 | |||||||||||||||||||||||||||||||||||||||||||||||||||||||||||||||||||||||||||||||||||||||||||||||||||
| Democrats | 95 | |||||||||||||||||||||||||||||||||||||||||||||||||||||||||||||||||||||||||||||||||||||||||||||||||||
| Gallup | ||||||||||||||||||||||||||||||||||||||||||||||||||||||||||||||||||||||||||||||||||||||||||||||||||||
Obama's current rating is far more politically polarized than Bush's. To some degree, that may reflect the passage of time since each was president -- just five months for Obama versus eight years for Bush -- giving Americans more time to forget about any political disagreements they may have had with Bush.
Both Bush and Obama have a ways to go to match the post-presidential highs in favorability Gallup has recorded for other recent presidents using the current favorable/unfavorable wording -- although there are only a small number of these measures and they date back only to Jimmy Carter. Ronald Reagan set the record with a 74% favorable rating in January 2001, with George H.W. Bush a close second at 73%. Carter and Bill Clinton have reached highs of 69% favorability.
The low point for post-presidential favorability using this measure was George W. Bush's 35% rating in 2009, but Clinton came close with a 39% reading in March 2001. That was shortly after Clinton drew considerable criticism over some of his last-minute presidential pardons.
Bottom Line
Former presidents George W. Bush and Obama have largely strived to stay out of the public eye since leaving office, although for Bush that has lasted over eight years versus Obama's five months, thus far.
Bush has not stirred much controversy, as he comments little on issues or candidates, and is usually in the news only for an occasional appearance on behalf of a pet cause or publicity about his newfound love of painting. Perhaps accordingly, his image has gradually recovered to a level not seen since a few months after he won re-election in 2004, mainly because of improved ratings from independents and Democrats.
When Obama left office, he was much more popular than Bush was when he left office, and he has studiously avoided commenting on President Donald Trump's policies until he recently spoke against the United States' withdrawal from the Paris climate accord. Obama has maintained his high rating, but he could see more improvement in the coming years if Republicans warm to him.
For now, Bush and Obama have similar images among Americans -- each viewed favorably by about six in 10 adults. That far outpaces the sitting president's popularity -- with Trump registering only 40% favorability in the current poll -- as well as the ex-presidents' own favorability ratings for much of their terms. While Trump may present a contrast in temperament to Bush and Obama, that likely isn't affecting the former presidents' image ratings, because Bush's favorable score has been climbing for years and Obama's hasn't changed much in the few months since Trump became president.
Historical data are available in Gallup Analytics.
Survey Methods
Results for this Gallup poll are based on telephone interviews conducted June 7-11, 2017, with a random sample of 1,009 adults, aged 18 and older, living in all 50 U.S. states and the District of Columbia. For results based on the total sample of national adults, the margin of sampling error is ±4 percentage points at the 95% confidence level. All reported margins of sampling error include computed design effects for weighting.
Each sample of national adults includes a minimum quota of 70% cellphone respondents and 30% landline respondents, with additional minimum quotas by time zone within region. Landline and cellular telephone numbers are selected using random-digit-dial methods.
View survey methodology, complete question responses and trends.


