Thanksgiving Week Consumer Spending on Par With 2016
Story Highlights
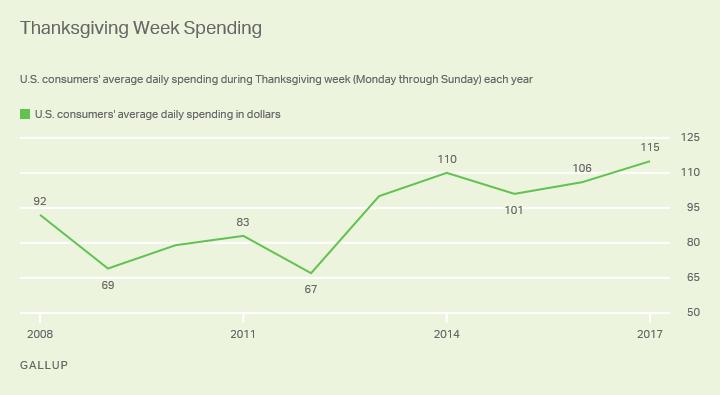
- Americans spent average of $115 daily this year, similar to $106 in 2016
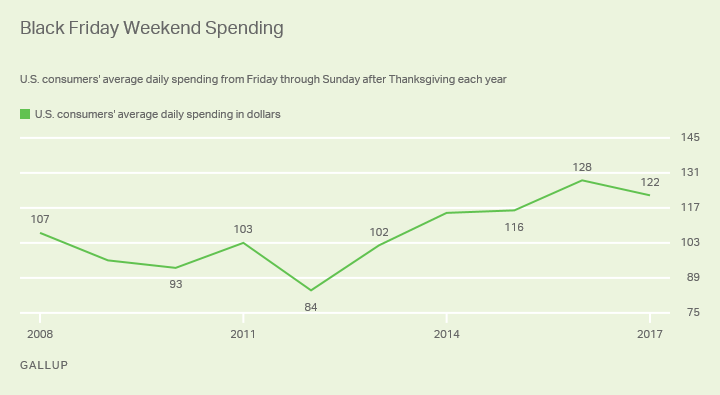
- Spending on Black Friday weekend levels off at 10-year high point
WASHINGTON, D.C. -- Americans' self-reported daily spending during
Thanksgiving week averaged $115, similar to their $106 average during
the same week a year ago. This year's figure is clearly on the high
end of consumers' Thanksgiving-week spending over the past decade,
which includes dips below $70 in 2009 and 2012.
The latest spending average is based on Gallup Daily tracking, reflecting
spending that occurred from Sunday, Nov. 19 through Saturday, Nov. 25,
including Black Friday. The question reads, "Next, we'd like
you to think about your spending yesterday, not counting the purchase
of a home, motor vehicle or your normal household bills. How much money
did you spend or charge yesterday on all other types of purchases you
may have made, such as at a store, restaurant, gas station, online or
elsewhere?"
Although the Gallup spending measure captures gift purchases and holiday-related
splurges, it is not purely a measure of holiday retail sales but of consumer
spending generally. This overall spending metric provides some valuable
context for spending estimates specific to particular retailers or types
of spending that are released during the holiday season.
Spending Over Black Friday Weekend Levels Off at 10-Year High Point
Looking just at spending reports for Black Friday and the weekend (including
spending on Friday, Saturday and Sunday), Gallup also finds overall consumer
spending relatively flat compared with 2016. Consumers' self-reported
daily spending averaged $122 over Black Friday weekend this year, compared
with an average $128 in 2016.
Still, as seen with spending for all of Thanksgiving week, this year's
Black Friday weekend spending is on the high end of what Gallup has recorded
each year since 2008. It is particularly high compared with the 2008-2009
recession and immediate post-recession years.
Implications
U.S. retailers depend heavily on Black Friday sales -- so much so that
stores are now offering Black Friday sales days earlier and extending
them through the weekend, until the retail frenzy turns to "Cyber
Monday." Preliminary industry estimates of consumers' online
Black Friday purchases are encouraging, suggesting sales are up by double
digits over 2016. However, it is still not clear how brick-and-mortar
sales have been affected, or whether consumers are spending less on routine
expenses so they can afford to splurge on too-good-to-pass-up holiday
sales promotions.
The relative stability between 2016 and 2017 in Americans' self-reported
daily spending over Thanksgiving week and Black Friday weekend suggests
that consumers may, in fact, be cutting back on some types of spending
to pay for others. However, with four weeks to go before Christmas, shoppers
still have plenty of time to make good on their intention to
spend a record amount on Christmas gifts this year. Those who didn't jump at the Black Friday sales may be
holding out for even better deals as the season wears on.
Survey Methods
These results are based on telephone interviews conducted on the Gallup
U.S. Daily survey with U.S. adults aged 18 and older, living in all 50
U.S. states and the District of Columbia. The average daily spending estimate
for Thanksgiving week is based on a random sample of 2,956 adults interviewed
Nov. 20-27, 2017, and has a margin of sampling error of ±$14 at
the 95% confidence level. The average daily spending estimate for Black
Friday weekend is based on a random sample of 1,478 adults interviewed
Nov. 25-27, and has a margin of sampling error of ±$20 at the 95%
confidence level. All reported margins of sampling error include computed
design effects for weighting.
Each sample of national adults includes a minimum quota of 70% cellphone
respondents and 30% landline respondents, with additional minimum quotas
by time zone within region. Landline and cellular telephone numbers are
selected using random-digit-dial methods.
Learn more about how the
Gallup U.S. Daily works.


