Story Highlights
- 67% of Americans support affirmative action for women
- Slightly fewer, 58%, support affirmative action for minorities
- Women more likely than men to support both programs
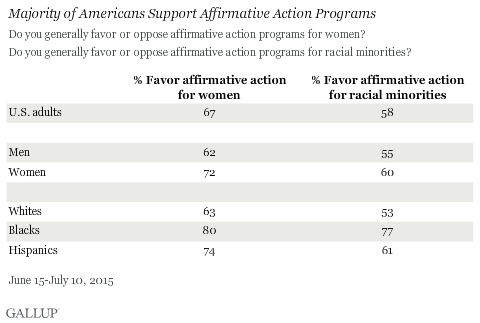
WASHINGTON, D.C. -- A majority of Americans say they favor affirmative action programs. However, support is a bit higher for programs aimed at helping women (67%) than for those focused on helping racial minorities (58%).

While majorities of men, women, whites, blacks and Hispanics are in favor of affirmative action programs, support varies according to each groups' connection to the program. Women are more likely than men to support affirmative action programs for women, by 72% to 62%, respectively. Blacks (77%) and Hispanics (61%) are more likely than whites (53%) to support affirmative action programs for racial minorities.
These findings are from Gallup's Minority Rights and Relations survey conducted June 15-July 10 with more than 2,000 U.S. adults, including expanded samples of blacks and Hispanics. The last time these questions were asked in 2013, the findings were similar.
White Men Least Likely to Support Either Affirmative Action Program
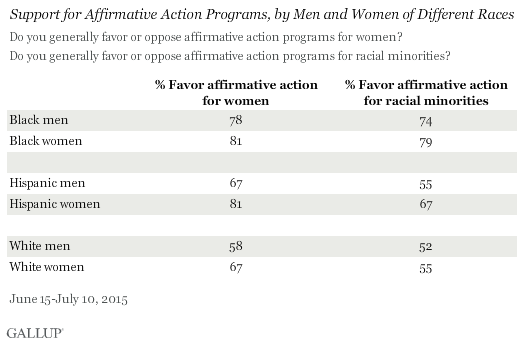
While still a majority, support among white men trails support among white women for affirmative action programs for women and for minorities. Black women and Hispanic women are more likely than white women to support affirmative action for women, 81% versus 67%, respectively.
While all racial and gender groups' support for affirmative action is higher for programs aimed at women than those aimed at minorities, differences in support for the two programs vary by subgroup. Blacks' level of support for affirmative action targeted at women and minorities are similar. But Hispanics and whites are much more likely to favor programs for women than those for minorities.

Less Than Half of Republicans Support Affirmative Action for Minorities
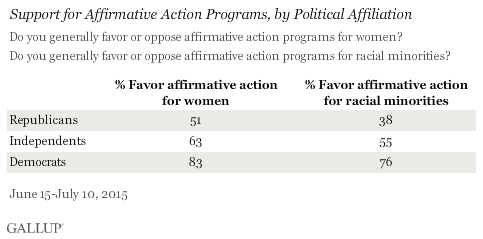
Support for both types of affirmative action programs differs markedly by political party identification. More than eight in 10 Democrats support affirmative action for women, and 76% support it for racial minorities. Solid majorities of independents also support both types of programs. Republicans are split: Just over half favor affirmative action for women, but fewer than four in 10 favor it for racial minorities.

Implications
Affirmative action programs were traditionally created to help avoid discrimination against women and minority applicants at educational institutions, like colleges, and in hiring for jobs. These groups were historically at a disadvantage when applying because of racial or gender prejudice and even legal discrimination. However, some educational institutions are finding alternate ways to increase diversity without affirmative action. And in 2014, the U.S. Supreme Court upheld Michigan's ban on considering race in college applications.
Some claim that affirmative action puts whites or men at an unfair disadvantage, that it can create reverse discrimination or even that it can hurt minorities and women. The U.S. Supreme Court recently announced it would reconsider a case last brought before it in 2013 in which a white woman claims she was denied admission to the University of Texas because of a race-based affirmative action program the university used at that time. Affirmative action may again be an issue in 2016 and could become less used, or even banned, because of this case. However, a majority of Americans of all genders and races continue to support affirmative action programs.
Historical data on these questions are available in Gallup Analytics.
Survey Methods
Results for this Gallup poll are based on telephone interviews conducted June 15-July 10, 2015, with a random sample of 2,296 adults, aged 18 and older, living in all 50 U.S. states and the District of Columbia, including oversamples of black and Hispanic adults. All respondents had previously been interviewed in the Gallup Daily tracking survey. For results based on the total sample of national adults, the margin of sampling error is ±4 percentage points at the 95% confidence level.
For results based on the total sample of 857 non-Hispanic whites, the maximum margin of sampling error is ±5 percentage points.
For results based on the total sample of 802 non-Hispanic blacks, the maximum margin of sampling error is ±5 percentage points.
For results based on the total sample of 508 Hispanics, the maximum margin of sampling error is ±7 percentage points (138 out of the 508 interviews with Hispanics were conducted in Spanish).
For results based on the total sample of 1,148 men, the maximum margin of sampling error is ±5 percentage points.
For results based on the total sample of 1,148 women, the maximum margin of sampling error is ±5 percentage points.
All reported margins of sampling error include computed design effects for weighting.
View survey methodology, complete question responses and trends.
Learn more about how Gallup Poll Social Series works.

