
Americans Choose "Pro-Choice" for First Time in Seven Years
Story Highlights
- Americans divide 50% "pro-choice," 44% "pro-life" on abortion
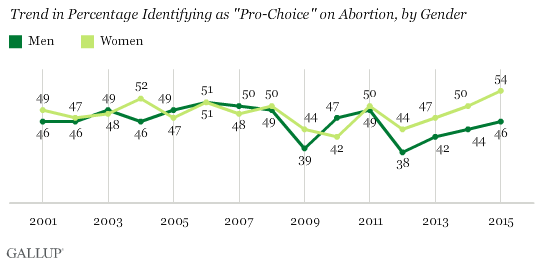
- Majority of women, 54%, now pro-choice, vs. 46% of men
- Pro-choice ID among Democrats has swelled since 2001
PRINCETON, N.J. -- Half of Americans consider themselves "pro-choice" on abortion, surpassing the 44% who identify as "pro-life." This is the first time since 2008 that the pro-choice position has had a statistically significant lead in Americans' abortion views.
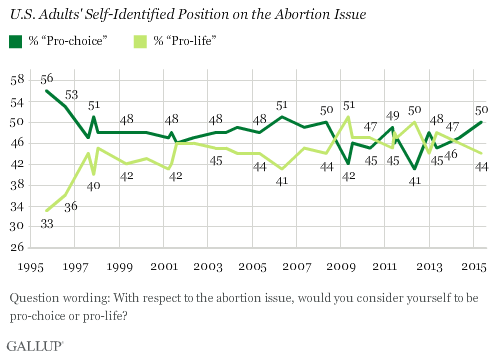
For most of the past five years, Americans have been fairly evenly divided in their association with the two abortion labels. The only exception between 2010 and 2014 was in May 2012, when the pro-life position led by 50% to 41%.
Prior to 2009, the pro-choice side almost always predominated, including in the mid-1990s by a substantial margin. While support for the pro-choice position has yet to return to the 53% to 56% level seen at the time, the trend has been moving in that direction since the 2012 reading.
While Gallup does not define the pro-choice and pro-life terms for Americans, their answers to a separate question about the legality of abortion indicate that those favoring the pro-choice label generally support broad abortion rights, while pro-life adherents mostly favor limited or no abortion rights.
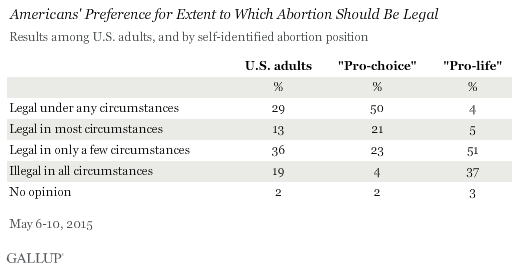
The latest results are based on Gallup's May 6-10 Values and Beliefs poll. Gallup began tracking Americans' identification as "pro-choice" or "pro-life" at least annually in 2001.
Modest Gender Gap Seen in Abortion Views Since 2012
The recent increase in the pro-choice side has occurred almost equally among men and women. However, for men, this has not compensated for the larger drop in their identification as pro-choice in 2012. As a result, a slight gender gap has emerged over the last three years, with women more likely than men to be pro-choice. This contrasts with 2001 through 2011, when there was virtually no gender gap.
On a longer-term basis, a higher percentage of women today than in 2001 call themselves pro-choice, while men's identification is about the same.
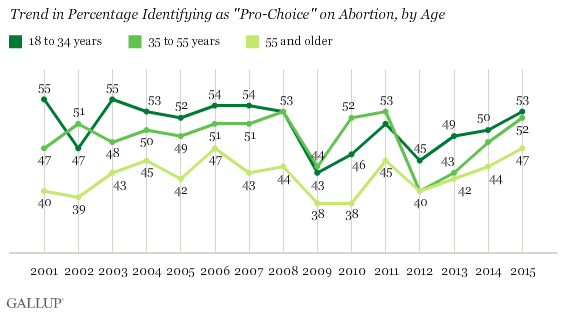
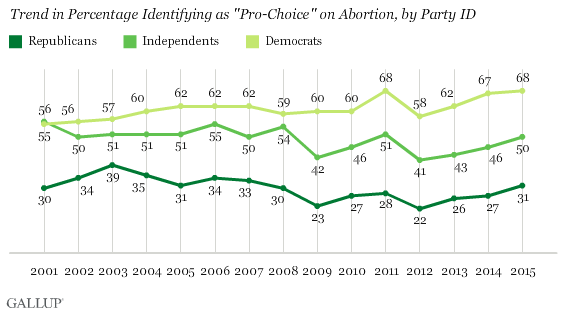
The trends by age and party ID show a similar pattern, with support for the pro-choice label dipping among all age and party groups in 2012, but subsequently returning to 2008 levels or higher.
The biggest change by age since 2001 is that middle-aged and older Americans are more likely to be pro-choice today, while the percentage of young adults who identify with the term is about the same.
Given the increase in pro-choice support since 2012, Republicans' and independents' identification as pro-choice is about the same today as in 2001, whereas Democrats' pro-choice ID has expanded (to 68%, up from 55%).
Bottom Line
The pro-choice view is not as prevalent among Americans as it was in the mid-1990s, but the momentum for the pro-life position that began when Barack Obama took office has yielded to a pro-choice rebound. That rebound has essentially restored views to where they were in 2008; today's views are also similar to those found in 2001. Some of the variation in public views on abortion over time coincides with political and cultural events that may have helped shape public opinion on the issue, including instances of anti-abortion violence, legislative efforts to ban "partial-birth abortion" or limit abortion funding, and certain Supreme Court cases. While events like these may continue to cause public views on abortion to fluctuate, the broader liberal shift in Americans' ideology of late could mean the recent pro-choice expansion has some staying power.
Survey Methods
Results for this Gallup poll are based on telephone interviews conducted May 6-10, 2015, with a random sample of 1,024 adults, aged 18 and older, living in all 50 U.S. states and the District of Columbia. For results based on the total sample of national adults, the margin of sampling error is ±4 percentage points at the 95% confidence level. All reported margins of sampling error include computed design effects for weighting.
Each sample of national adults includes a minimum quota of 50% cellphone respondents and 50% landline respondents, with additional minimum quotas by time zone within region. Landline and cellular telephone numbers are selected using random-digit-dial methods.
View survey methodology, complete question responses, and trends.
Learn more about how Gallup Poll Social Series works.
