Story Highlights
- Republicans have net-negative opinions of Roberts, Kennedy
- Republicans have net-positive opinions of Scalia
- Ratings of Scalia, Roberts more negative than in past
More Democrats have a favorable than an unfavorable view of Republican-appointed U.S. Supreme Court Justices Anthony Kennedy and John Roberts, while Republicans' opinions of the justices are much more negative than positive. Democrats' views of another GOP-appointed justice, Antonin Scalia, are more unfavorable than favorable, while Republicans rate him favorably.
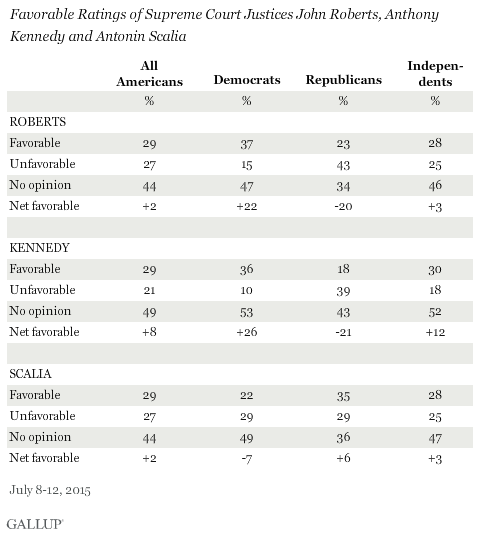
Kennedy, Roberts and Scalia are arguably the three most prominent members of the Supreme Court. Chief Justice Roberts and Kennedy often find themselves as the swing votes in cases divided along ideological lines. For example, Roberts sided with the liberal justices to uphold the Affordable Care Act in 2012, while Kennedy has been the deciding vote on recent gay rights cases, including the most recent one that legalized same-sex marriage. Scalia is the most vocal member of the court's conservative wing -- known for his biting and colorful dissenting opinions.
It appears their high-profile deciding votes on same-sex marriage and the Affordable Care Act have endeared Kennedy and Roberts to Democrats and turned Republicans off to them, even though all were appointed by a Republican president and typically vote more with the court's conservative wing than its liberal wing.
Scalia currently produces a less strong partisan reaction, although Republicans view him a bit more favorably than unfavorably, while the reverse is true for Democrats.
Justices Not Well-Known to Americans
Overall, Americans are not highly familiar with these three justices, as only half or slightly more than half have an opinion of any of them. And none are viewed overly positively by those who do have opinions, with Kennedy's +8 net favorable rating (based on 29% having a favorable and 21% an unfavorable view of him) the best of the three justices included in the July 8-12 Gallup poll.
The poll marks the first time Gallup has measured opinion on Kennedy, but it has asked about Roberts and Scalia previously. Opinions of both justices are less positive now than in the past.
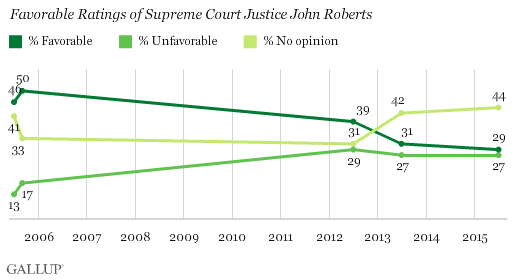
Gallup first asked about Roberts after President George W. Bush nominated him to the Supreme Court in 2005. At that time, he was well-liked, with favorable ratings near 50%. Positive ratings of Roberts fell to 39% the next time Gallup asked about him in July 2012 -- right after he cast the deciding vote in the ACA case. Since then, Americans have largely been divided in their views of him, but are also less likely to have an opinion of him.
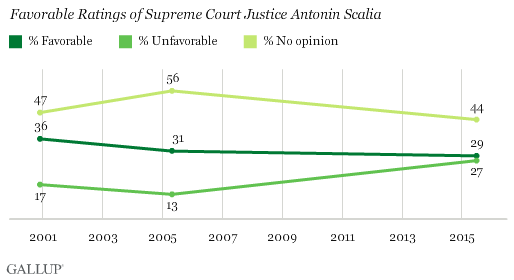
Americans are more likely to have an opinion of Scalia now than in Gallup's prior update in 2005. But his image has gone from a mainly positive one to a divided one, mostly because of an increase in negative opinions of him, from 13% in 2005 to 27% today. His favorable rating is similar to what it was a decade ago.
Republicans Fuel Slide in Images of Roberts, Scalia
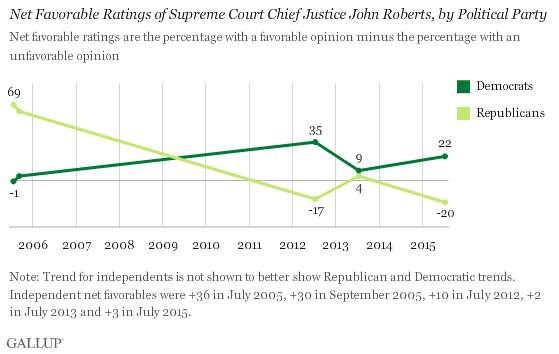
At the time Roberts was nominated, his net favorable rating among Republicans was +69 (70% favorable, 1% unfavorable). After the 2012 ACA vote, more Republicans viewed him unfavorably (44%) than favorably (27%), while Democrats shifted to a net-positive evaluation of him (54% favorable, 19% unfavorable) from a neutral one.
Those views eased in a 2013 update, but after the latest Supreme Court term, which included another Roberts vote to uphold the ACA, Democrats have again grown significantly more positive and Republicans more negative toward him.
Scalia's image has suffered among Republicans, Democrats and independents since 2005, but has suffered the most among Republicans. In 2005, 43% of Republicans had a favorable opinion of him and 7% an unfavorable opinion, for a net favorable rating of +36. Independents (31% favorable, 13% unfavorable) and Democrats (21% favorable, 17% unfavorable) viewed him more positively than negatively then. Democrats' views of Scalia are now more negative than positive, while independents' views are barely more positive than negative.
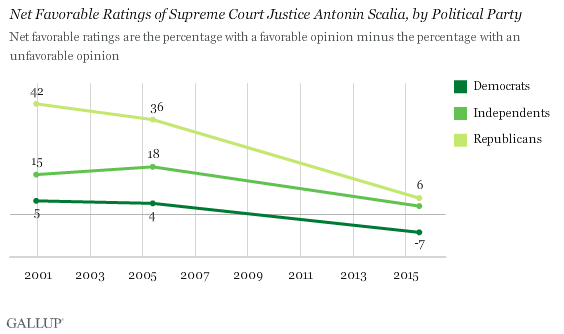
Even though Scalia has been a consistent conservative vote, Republicans' current widespread dissatisfaction with the high court more generally may be influencing how they feel about him.
Implications
Democrats and Republicans often revise their views of the Supreme Court, depending on how its rulings in major cases fit with their policy preferences. And this year saw dramatic shifts in opinions of the court by political party.
That same phenomenon appears to affect how Americans view individual members of the Supreme Court, even though the justices are generally not well-known to Americans. The high court is officially a nonpartisan institution, but the justices' ideological leanings are evident in their voting patterns, and presidents seek to influence the ideological direction of the court through their appointments. Although Kennedy and Roberts are Republican appointees and vote more often with the conservative justices than the liberal ones, their votes in high-profile cases such as those involving same-sex marriage and the Affordable Care Act have seemingly done more to influence how Republicans and Democrats feel about them.
Republicans still hold a marginally positive view of Scalia but are less favorable toward him than in the past. They may give him less credit for voting in a way consistent with Republican policy preferences than they penalize him for being a member of an institution they view so negatively at the moment.
Survey Methods
Results for this Gallup poll are based on telephone interviews conducted July 8-12, 2015, with a random sample of 1,009 adults, aged 18 and older, living in all 50 U.S. states and the District of Columbia. For results based on the total sample of national adults, the margin of sampling error is ±4 percentage points at the 95% confidence level.
All reported margins of sampling error include computed design effects for weighting.
Each sample of national adults includes a minimum quota of 50% cellphone respondents and 50% landline respondents, with additional minimum quotas by time zone within region. Landline and cellular telephone numbers are selected using random-digit-dial methods.
View survey methodology, complete question responses, and trends.
Learn more about how Gallup Poll Social Series works.

